
House Prices in Burnfarm
House prices in Burnfarm have an overall average of £312,038 over the last year.
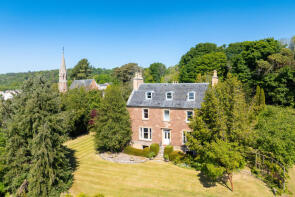
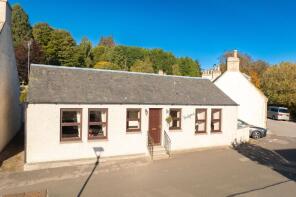
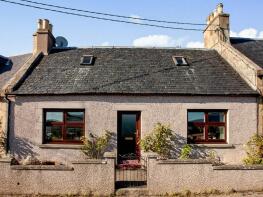
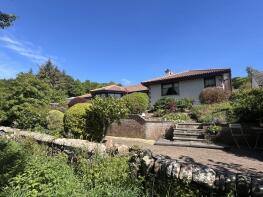
The majority of properties sold in Burnfarm during the last year were detached properties, selling for an average price of £402,600. Semi-detached properties sold for an average of £256,750, with terraced properties fetching £200,000.
Overall, the historical sold prices in Burnfarm over the last year were 38% up on the previous year and 25% up on the 2022 peak of £249,092.
Properties Sold
Hill House, Braehead, Avoch IV9 8QL
| Today | See what it's worth now |
| 3 Mar 2026 | £560,000 |
No other historical records.
Bridgend, Henrietta Street, Avoch IV9 8QT
| Today | See what it's worth now |
| 29 Jan 2026 | £238,000 |
No other historical records.
5 Roselea, Braehead, Avoch IV9 8QL
| Today | See what it's worth now |
| 2 Dec 2025 | £225,000 |
| 11 Dec 2014 | £155,100 |
4, Fletcher Gardens, Avoch IV9 8RA
| Today | See what it's worth now |
| 1 Dec 2025 | £420,000 |
| 11 Nov 2005 | £45,000 |
21, Knockmuir View, Avoch IV9 8RY
| Today | See what it's worth now |
| 27 Nov 2025 | £460,000 |
| 13 Oct 2020 | £346,000 |
No other historical records.
Mizpah Cottage, Henrietta Street, Avoch IV9 8QT
| Today | See what it's worth now |
| 24 Nov 2025 | £340,000 |
| 23 Jul 2020 | £225,000 |
Darkswood, Rosehaugh East Drive, Avoch IV9 8RE
| Today | See what it's worth now |
| 3 Nov 2025 | £335,000 |
No other historical records.
Jemima Villa, Henrietta Street, Avoch IV9 8QT
| Today | See what it's worth now |
| 14 Oct 2025 | £312,000 |
No other historical records.
6 Galloway Cottage, Ormonde Terrace, Avoch IV9 8QU
| Today | See what it's worth now |
| 13 Oct 2025 | £220,000 |
| 15 Jun 2020 | £150,000 |
7a, Margaret Street, Avoch IV9 8PX
| Today | See what it's worth now |
| 30 Sep 2025 | £175,000 |
| 23 May 2024 | £170,000 |
3, George Street, Avoch IV9 8PU
| Today | See what it's worth now |
| 17 Sep 2025 | £155,000 |
| 11 Sep 2013 | £100,000 |
East Wing, Tower House, Station Road, Avoch IV9 8PS
| Today | See what it's worth now |
| 22 Aug 2025 | £430,000 |
| 31 Aug 2022 | £495,000 |
5, Burnfarm Cottages, Burnfarm Road, Killen IV9 8RG
| Today | See what it's worth now |
| 22 Aug 2025 | £186,500 |
No other historical records.
4, Park Street, Avoch IV9 8QQ
| Today | See what it's worth now |
| 26 May 2025 | £380,000 |
No other historical records.
Inveravon, The Dock, Avoch IV9 8QG
| Today | See what it's worth now |
| 26 May 2025 | £350,000 |
No other historical records.
Ardachy, Muiralehouse Farm Access Road, Avoch IV9 8RN
| Today | See what it's worth now |
| 5 Mar 2025 | £295,000 |
| 4 Sep 2018 | £250,000 |
19, The Dock, Avoch IV9 8QG
| Today | See what it's worth now |
| 4 Mar 2025 | £145,000 |
| 16 Apr 2019 | £92,000 |
No other historical records.
5, Mackenzie Place, Avoch IV9 8QW

| Today | See what it's worth now |
| 7 Jan 2025 | £148,000 |
| 6 May 2014 | £122,000 |
9, Margaret Street, Avoch IV9 8PX
| Today | See what it's worth now |
| 24 Dec 2024 | £197,500 |
| 18 Jan 2005 | £110,000 |
No other historical records.
3, Mackay Terrace, Avoch IV9 8QY
| Today | See what it's worth now |
| 6 Dec 2024 | £125,000 |
No other historical records.
Arras Cottage, Braehead, Avoch IV9 8QL
| Today | See what it's worth now |
| 4 Dec 2024 | £192,000 |
| 24 Jul 2003 | £130,000 |
No other historical records.
1, Mackenzie Place, Avoch IV9 8QW
| Today | See what it's worth now |
| 12 Nov 2024 | £163,000 |
| 22 May 2007 | £99,000 |
No other historical records.
23, Ormonde Terrace, Avoch IV9 8QU
| Today | See what it's worth now |
| 7 Nov 2024 | £180,000 |
No other historical records.


Source Acknowledgement: © Crown copyright. Scottish house price data is publicly available information produced by the Registers of Scotland. Material has been reproduced with the permission of the Keeper of the Registers of Scotland and contains data compiled by Registers of Scotland. For further information, please contact data@ros.gov.uk. Please note the dates shown here relate to the property's registered date not sold date.This material was last updated on 10 July 2026. It covers the period from 8 December 1987 to 30 April 2026 and contains property transactions which have been registered during that period.
Disclaimer: Rightmove.co.uk provides this Registers of Scotland data "as is". The burden for fitness of the data relies completely with the user and is provided for informational purposes only. No warranty, express or implied, is given relating to the accuracy of content of the Registers of Scotland data and Rightmove plc does not accept any liability for error or omission. If you have found an error with the data or need further information please contact data@ros.gov.uk
Permitted Use: The Registers of Scotland allows the reproduction of the data which it provides to Rightmove.co.uk free of charge in any format or medium only for research, private study or for internal circulation within an organisation. This is subject to it being reproduced accurately and not used in a misleading context. The material must be acknowledged as Crown Copyright. You are not allowed to use this information for commercial purposes, nor must you copy, distribute, sell or publish the data in any way. For any other use of this material, please apply to the Registers of Scotland for a licence. You can do this online at www.ros.gov.uk, by email at data@ros.gov.uk or by writing to Business Development, Registers of Scotland, Meadowbank House, 153 London Road, Edinburgh EH8 7AU.
Rightmove takes no liability for your use of, or reliance on, Rightmove's Instant Valuation due to the limitations of our tracking tool listed here. Use of this tool is taken entirely at your own risk. All rights reserved.