
House Prices in Burray
House prices in Burray have an overall average of £275,000 over the last year.
Overall, the historical sold prices in Burray over the last year were similar to the previous year and 8% up on the 2023 peak of £255,667.
Properties Sold
Gallowhill, Viewforth Road, Orkney KW17 2SZ

| Today | See what it's worth now |
| 6 Oct 2025 | £425,000 |
| 15 May 2015 | £155,000 |
No other historical records.
Ourigaire, Westshore Road, Orkney KW17 2SS
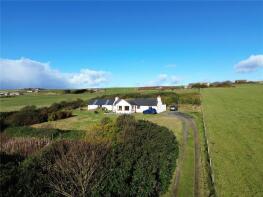
| Today | See what it's worth now |
| 27 May 2025 | £310,000 |
| 27 May 2005 | £105,000 |
No other historical records.
1, West Links, Village Road, Burray Village, Orkney KW17 2SS
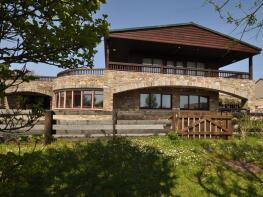
| Today | See what it's worth now |
| 11 Mar 2025 | £90,000 |
| 3 Nov 2016 | £187,000 |
No other historical records.
Standing Stone, Littlequoy Road, Burray KW17 2SX
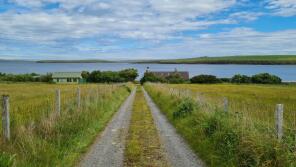
| Today | See what it's worth now |
| 24 Dec 2024 | £243,500 |
No other historical records.
6, West Links, Village Road, Burray Village, Orkney KW17 2SS
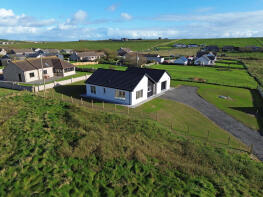
| Today | See what it's worth now |
| 13 Dec 2024 | £232,000 |
| 27 Jun 2024 | £260,000 |
Blinkbonny, Hillfield Road, Orkney KW17 2SU
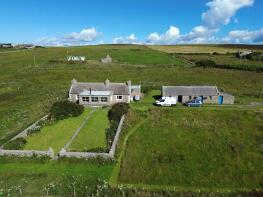
| Today | See what it's worth now |
| 3 Dec 2024 | £232,500 |
| 26 Jul 2021 | £215,000 |
No other historical records.
Dunromin, Littlequoy Road, Orkney KW17 2SX
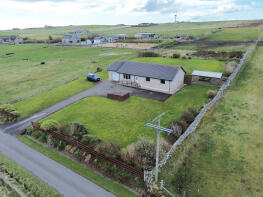
| Today | See what it's worth now |
| 6 Aug 2024 | £265,000 |
No other historical records.
Newbister, Littlequoy Road, Orkney KW17 2SX

| Today | See what it's worth now |
| 18 Jul 2024 | £375,000 |
| 27 Aug 2019 | £57,500 |
Saorsa, Littlequoy Road, Orkney KW17 2SU

| Today | See what it's worth now |
| 2 Jul 2024 | £325,000 |
| 23 Apr 2007 | £187,000 |
No other historical records.
1, Leaburn, Burray Village, Orkney KW17 2TB
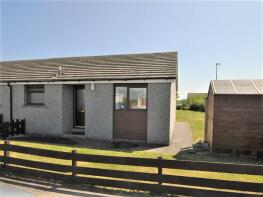
| Today | See what it's worth now |
| 14 Sep 2023 | £117,000 |
| 5 Sep 2019 | £78,000 |
Hayburn, Littlequoy Road, Orkney KW17 2SX
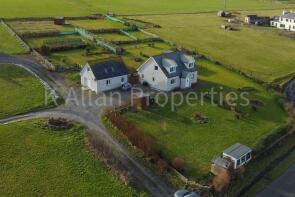
| Today | See what it's worth now |
| 4 Sep 2023 | £370,000 |
No other historical records.
Waterview Cottage, Village Road, Burray Village, Orkney KW17 2SS
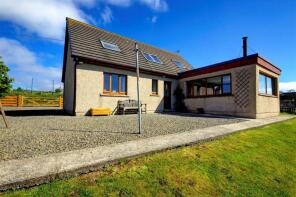
| Today | See what it's worth now |
| 28 Sep 2022 | £316,500 |
No other historical records.
Skeldro, A961 From Braegarth To 100m North Of Old Burray School, Burray Village, Orkney KW17 2SS
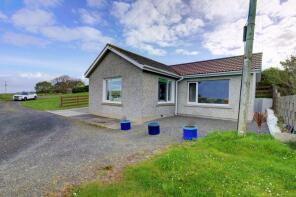
| Today | See what it's worth now |
| 12 Aug 2022 | £165,000 |
| 8 Jul 2019 | £98,000 |
Lynnview, Littlequoy Road, Orkney KW17 2SX

| Today | See what it's worth now |
| 23 Mar 2022 | £135,000 |
| 1 Oct 2018 | £100,000 |
Fernleigh, A961 From Braegarth To 100m North Of Old Burray School, Burray Village, Orkney KW17 2SS

| Today | See what it's worth now |
| 21 Sep 2021 | £242,500 |
| 1 Feb 2019 | £188,000 |
No other historical records.
7, Leaburn, Burray Village, Orkney KW17 2TB
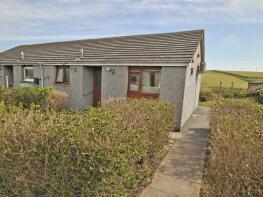
| Today | See what it's worth now |
| 6 Sep 2021 | £87,000 |
No other historical records.
Kylar, A961 From Braegarth To 100m North Of Old Burray School, Burray Village, Orkney KW17 2SS

| Today | See what it's worth now |
| 26 May 2021 | £270,250 |
No other historical records.
11, Upper Waston Road, Burray Village, Orkney KW17 2TT

| Today | See what it's worth now |
| 29 Mar 2021 | £86,250 |
No other historical records.
Lower Lochhouse, Burray KW17 2SU

| Today | See what it's worth now |
| 17 Feb 2021 | £175,000 |
| 14 Nov 2014 | £30,000 |
No other historical records.
Heathervale, Littlequoy Road, Orkney KW17 2SX

| Today | See what it's worth now |
| 29 Jan 2021 | £135,000 |
No other historical records.
Aermara, Bu Road, Orkney KW17 2SZ
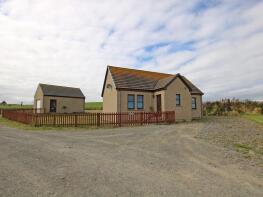
| Today | See what it's worth now |
| 3 Nov 2020 | £156,000 |
| 29 Aug 2018 | £145,500 |
Burnbank, A961 From Braegarth To 100m North Of Old Burray School, Burray Village, Orkney KW17 2SS

| Today | See what it's worth now |
| 24 Feb 2020 | £270,000 |
No other historical records.
Clair Lea, A961 From Braegarth To 100m North Of Old Burray School, Burray Village, Orkney KW17 2SS
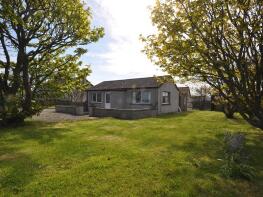
| Today | See what it's worth now |
| 30 Sep 2019 | £86,250 |
No other historical records.
Viewforth, Viewforth Road, Orkney KW17 2SY

| Today | See what it's worth now |
| 27 Mar 2019 | £300,000 |
No other historical records.
Westermill, Westshore Road, Burray Village, Orkney KW17 2SS

| Today | See what it's worth now |
| 27 Feb 2019 | £170,000 |
No other historical records.
Source Acknowledgement: © Crown copyright. Scottish house price data is publicly available information produced by the Registers of Scotland. Material has been reproduced with the permission of the Keeper of the Registers of Scotland and contains data compiled by Registers of Scotland. For further information, please contact data@ros.gov.uk. Please note the dates shown here relate to the property's registered date not sold date.This material was last updated on 2 December 2025. It covers the period from 8 December 1987 to 31 October 2025 and contains property transactions which have been registered during that period.
Disclaimer: Rightmove.co.uk provides this Registers of Scotland data "as is". The burden for fitness of the data relies completely with the user and is provided for informational purposes only. No warranty, express or implied, is given relating to the accuracy of content of the Registers of Scotland data and Rightmove plc does not accept any liability for error or omission. If you have found an error with the data or need further information please contact data@ros.gov.uk
Permitted Use: The Registers of Scotland allows the reproduction of the data which it provides to Rightmove.co.uk free of charge in any format or medium only for research, private study or for internal circulation within an organisation. This is subject to it being reproduced accurately and not used in a misleading context. The material must be acknowledged as Crown Copyright. You are not allowed to use this information for commercial purposes, nor must you copy, distribute, sell or publish the data in any way. For any other use of this material, please apply to the Registers of Scotland for a licence. You can do this online at www.ros.gov.uk, by email at data@ros.gov.uk or by writing to Business Development, Registers of Scotland, Meadowbank House, 153 London Road, Edinburgh EH8 7AU.
Map data ©OpenStreetMap contributors.
Rightmove takes no liability for your use of, or reliance on, Rightmove's Instant Valuation due to the limitations of our tracking tool listed here. Use of this tool is taken entirely at your own risk. All rights reserved.
