
House Prices in Burridge
House prices in Burridge have an overall average of £514,615 over the last year.
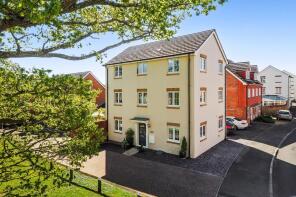
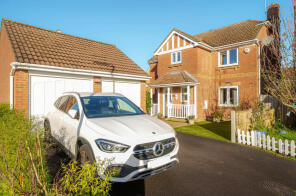
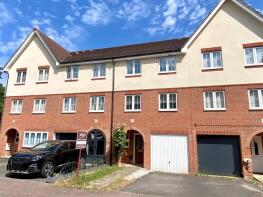
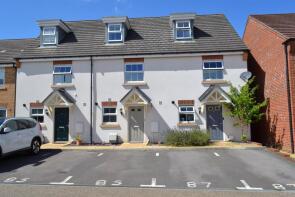
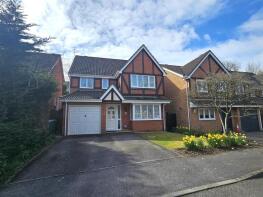
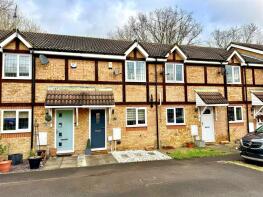
The majority of properties sold in Burridge during the last year were detached properties, selling for an average price of £636,250. Terraced properties sold for an average of £340,800, with semi-detached properties fetching £340,975.
Overall, the historical sold prices in Burridge over the last year were 3% down on the previous year and 3% up on the 2023 peak of £498,646.
Properties Sold
19, Sheridan Gardens, Whiteley, Fareham PO15 7DY
| Today | See what it's worth now |
| 27 Mar 2026 | £675,000 |
| 2 Jul 2015 | £385,000 |
228a Andine Lodge, Botley Road, Southampton SO31 1BL
| Today | See what it's worth now |
| 20 Feb 2026 | £1,145,000 |
| 10 Jul 2019 | £490,000 |
No other historical records.
11, Camargue Close, Whiteley, Fareham PO15 7DT
| Today | See what it's worth now |
| 12 Feb 2026 | £610,000 |
| 26 Sep 2008 | £325,000 |
6, Andalusian Gardens, Whiteley, Fareham PO15 7DU

| Today | See what it's worth now |
| 6 Jan 2026 | £655,000 |
| 17 Jun 2021 | £570,000 |
89, Bluebell Way, Whiteley PO15 7NU
| Today | See what it's worth now |
| 5 Jan 2026 | £345,000 |
| 29 Apr 2022 | £437,600 |
No other historical records.
6, Blake Close, Whiteley, Fareham PO15 7LT
| Today | See what it's worth now |
| 16 Dec 2025 | £399,950 |
| 19 Oct 2018 | £330,000 |
3 Little Acorns, Blake Close, Whiteley, Fareham PO15 7LT
| Today | See what it's worth now |
| 16 Dec 2025 | £597,500 |
| 28 Jun 2021 | £555,000 |
15, Jerome Street, Whiteley, Fareham PO15 7NJ
| Today | See what it's worth now |
| 30 Oct 2025 | £344,000 |
| 4 May 2018 | £292,000 |
5, Andalusian Gardens, Whiteley, Fareham PO15 7DU
| Today | See what it's worth now |
| 27 Oct 2025 | £430,000 |
| 9 Dec 2005 | £249,950 |
298, Botley Road, Burridge SO31 1BQ
| Today | See what it's worth now |
| 24 Oct 2025 | £780,000 |
No other historical records.
55, Coleridge Drive, Whiteley, Fareham PO15 7NN

| Today | See what it's worth now |
| 17 Oct 2025 | £282,000 |
| 12 May 2017 | £237,500 |
10, Dumas Drive, Whiteley, Fareham PO15 7LU
| Today | See what it's worth now |
| 3 Oct 2025 | £450,000 |
| 26 Mar 2008 | £327,950 |
No other historical records.
6, Kipling Close, Whiteley, Fareham PO15 7LR
| Today | See what it's worth now |
| 26 Sep 2025 | £352,500 |
| 20 Apr 2022 | £340,000 |
4, Kipling Close, Whiteley, Fareham PO15 7LR
| Today | See what it's worth now |
| 17 Sep 2025 | £525,000 |
| 10 Dec 1999 | £156,950 |
No other historical records.
9, Maryat Way, Whiteley, Fareham PO15 7NP
| Today | See what it's worth now |
| 5 Sep 2025 | £340,000 |
| 30 Apr 2021 | £340,000 |
85, Dumas Drive, Whiteley, Fareham PO15 7FS
| Today | See what it's worth now |
| 29 Aug 2025 | £322,500 |
No other historical records.
17, Andalusian Gardens, Whiteley, Fareham PO15 7DU
| Today | See what it's worth now |
| 4 Aug 2025 | £495,000 |
| 4 Dec 1995 | £99,995 |
No other historical records.
14, Kingsley Way, Whiteley, Fareham PO15 7NL
| Today | See what it's worth now |
| 27 Jun 2025 | £383,000 |
| 27 Sep 2018 | £320,000 |
1, Burridge Road, Burridge SO31 1BY

| Today | See what it's worth now |
| 26 Jun 2025 | £475,000 |
No other historical records.
24, Andalusian Gardens, Whiteley, Fareham PO15 7DU
| Today | See what it's worth now |
| 30 May 2025 | £281,000 |
| 24 Sep 2021 | £250,000 |
59, Dumas Drive, Whiteley, Fareham PO15 7LU
| Today | See what it's worth now |
| 23 May 2025 | £318,000 |
No other historical records.
216, Botley Road, Southampton SO31 1BL

| Today | See what it's worth now |
| 13 May 2025 | £955,000 |
| 26 Jul 2016 | £870,000 |
47, Lipizzaner Fields, Whiteley, Fareham PO15 7BH
| Today | See what it's worth now |
| 20 Mar 2025 | £610,000 |
| 13 May 2013 | £360,000 |
No other historical records.
Source Acknowledgement: © Crown copyright. England and Wales house price data is publicly available information produced by the HM Land Registry.This material was last updated on 9 July 2026. It covers the period from 1 January 1995 to 30 April 2026 and contains property transactions which have been registered during that period. Contains HM Land Registry data © Crown copyright and database right 2026. This data is licensed under the Open Government Licence v3.0.
Disclaimer: Rightmove.co.uk provides this HM Land Registry data "as is". The burden for fitness of the data relies completely with the user and is provided for informational purposes only. No warranty, express or implied, is given relating to the accuracy of content of the HM Land Registry data and Rightmove does not accept any liability for error or omission. If you have found an error with the data or need further information please contact HM Land Registry.
Permitted Use: Viewers of this Information are granted permission to access this Crown copyright material and to download it onto electronic, magnetic, optical or similar storage media provided that such activities are for private research, study or in-house use only. Any other use of the material requires the formal written permission of Land Registry which can be requested from us, and is subject to an additional licence and associated charge.
Rightmove takes no liability for your use of, or reliance on, Rightmove's Instant Valuation due to the limitations of our tracking tool listed here. Use of this tool is taken entirely at your own risk. All rights reserved.