
House Prices in Bussage
House prices in Bussage have an overall average of £359,010 over the last year.
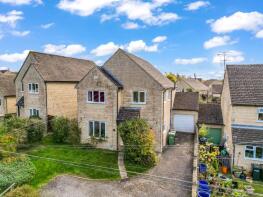
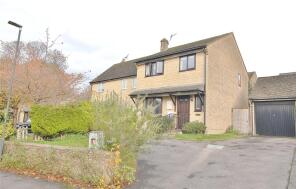
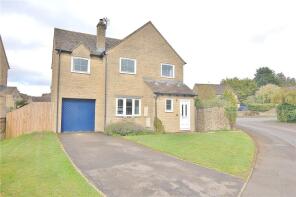
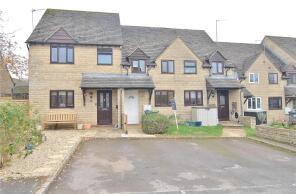
The majority of properties sold in Bussage during the last year were detached properties, selling for an average price of £460,712. Terraced properties sold for an average of £260,588, with semi-detached properties fetching £326,375.
Overall, the historical sold prices in Bussage over the last year were 3% down on the previous year and 4% down on the 2023 peak of £372,528.
Properties Sold
12, The Ridge, Bussage, Stroud GL6 8HD
| Today | See what it's worth now |
| 8 Apr 2026 | £450,000 |
| 18 Oct 2002 | £192,000 |
No other historical records.
51, Geralds Way, Chalford, Stroud GL6 8FJ

| Today | See what it's worth now |
| 27 Mar 2026 | £260,000 |
| 3 Jan 2001 | £128,500 |
No other historical records.
Shaance, The Ridge, Bussage, Stroud GL6 8HD
| Today | See what it's worth now |
| 20 Mar 2026 | £380,000 |
| 3 Oct 2005 | £188,000 |
30, Chasewood Corner, Chalford, Stroud GL6 8JS
| Today | See what it's worth now |
| 27 Feb 2026 | £420,000 |
| 22 Aug 2006 | £245,000 |
33, Dorington Court, Bussage, Stroud GL6 8EZ
| Today | See what it's worth now |
| 24 Feb 2026 | £240,000 |
| 30 Oct 2019 | £212,500 |
40, Stonecote Ridge, Bussage, Stroud GL6 8JY
| Today | See what it's worth now |
| 19 Feb 2026 | £404,000 |
| 20 Jun 2008 | £220,000 |
7, Farriers Croft, Bussage, Stroud GL6 8JW
| Today | See what it's worth now |
| 17 Feb 2026 | £255,000 |
| 25 Nov 1996 | £55,000 |
No other historical records.
Woodside, The Frith, Brownshill, Stroud GL6 8AD
| Today | See what it's worth now |
| 16 Feb 2026 | £775,000 |
| 9 Apr 2021 | £545,000 |
9, Munday Close, Bussage, Stroud GL6 8DG
| Today | See what it's worth now |
| 6 Feb 2026 | £385,000 |
No other historical records.
6, Eagle Close, Chalford, Stroud GL6 8FH
| Today | See what it's worth now |
| 4 Feb 2026 | £250,000 |
| 29 Jan 2021 | £120,000 |
18, Bluebell Chase, Chalford, Stroud GL6 8PG
| Today | See what it's worth now |
| 4 Feb 2026 | £325,000 |
| 20 Nov 2015 | £233,000 |
12, Frithwood Close, Bussage, Stroud GL6 8RA
| Today | See what it's worth now |
| 23 Jan 2026 | £220,000 |
| 2 Jun 2000 | £60,000 |
14, Sparrow Close, Chalford, Stroud GL6 8FP
| Today | See what it's worth now |
| 16 Jan 2026 | £445,000 |
| 28 Sep 2017 | £349,950 |
3, Ash Grove, The Old Common, Chalford, Stroud GL6 8GZ
| Today | See what it's worth now |
| 16 Jan 2026 | £295,000 |
| 15 Dec 2017 | £190,000 |
25, Lypiatt View, Bussage, Stroud GL6 8DA
| Today | See what it's worth now |
| 5 Jan 2026 | £347,000 |
| 11 May 2021 | £315,000 |
No other historical records.
Meiktila, Lyndholme To Tivoli Eastcombe, Bussage, Stroud GL6 8BB
| Today | See what it's worth now |
| 16 Dec 2025 | £599,950 |
| 17 Jun 2014 | £312,000 |
No other historical records.
54, Freame Close, Chalford, Stroud GL6 8HG
| Today | See what it's worth now |
| 12 Dec 2025 | £275,000 |
| 19 Nov 2021 | £232,000 |
9, Ash Grove, The Old Common, Chalford, Stroud GL6 8GZ
| Today | See what it's worth now |
| 12 Dec 2025 | £250,000 |
| 23 Oct 2000 | £80,702 |
No other historical records.
Corn Flag, The Ridge, Bussage, Stroud GL6 8BB
| Today | See what it's worth now |
| 28 Nov 2025 | £644,000 |
| 24 Jul 2014 | £400,000 |
No other historical records.
7, Hawk Close, Chalford, Stroud GL6 8FL
| Today | See what it's worth now |
| 24 Nov 2025 | £275,000 |
| 13 May 1999 | £58,950 |
No other historical records.
Ridgeways, The Ridgeway, Bussage, Stroud GL6 8BB
| Today | See what it's worth now |
| 21 Nov 2025 | £597,500 |
| 18 Aug 2011 | £250,000 |
No other historical records.
Lamotte, Middle Hill, Eastcombe, Stroud GL6 8BD
| Today | See what it's worth now |
| 12 Nov 2025 | £380,000 |
| 5 May 2009 | £205,000 |
No other historical records.
27, Munday Close, Bussage, Stroud GL6 8DG
| Today | See what it's worth now |
| 7 Nov 2025 | £360,000 |
| 24 Feb 1995 | £68,750 |
No other historical records.

Source Acknowledgement: © Crown copyright. England and Wales house price data is publicly available information produced by the HM Land Registry.This material was last updated on 9 July 2026. It covers the period from 1 January 1995 to 30 April 2026 and contains property transactions which have been registered during that period. Contains HM Land Registry data © Crown copyright and database right 2026. This data is licensed under the Open Government Licence v3.0.
Disclaimer: Rightmove.co.uk provides this HM Land Registry data "as is". The burden for fitness of the data relies completely with the user and is provided for informational purposes only. No warranty, express or implied, is given relating to the accuracy of content of the HM Land Registry data and Rightmove does not accept any liability for error or omission. If you have found an error with the data or need further information please contact HM Land Registry.
Permitted Use: Viewers of this Information are granted permission to access this Crown copyright material and to download it onto electronic, magnetic, optical or similar storage media provided that such activities are for private research, study or in-house use only. Any other use of the material requires the formal written permission of Land Registry which can be requested from us, and is subject to an additional licence and associated charge.
Rightmove takes no liability for your use of, or reliance on, Rightmove's Instant Valuation due to the limitations of our tracking tool listed here. Use of this tool is taken entirely at your own risk. All rights reserved.