
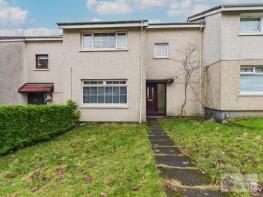
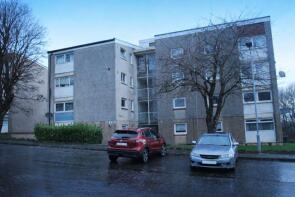
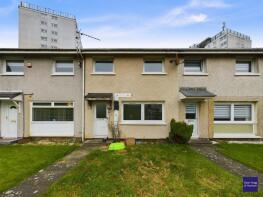
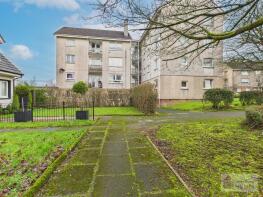
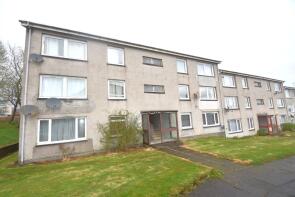
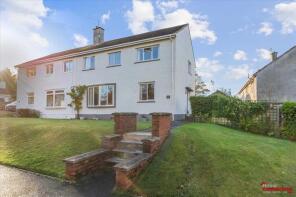
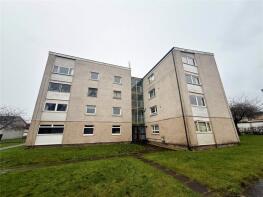
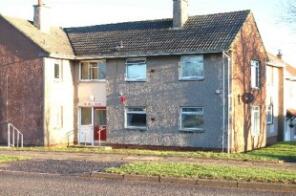
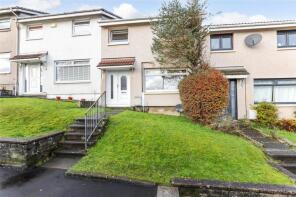
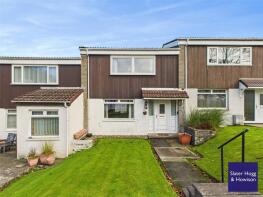
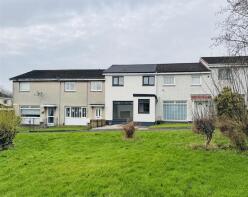
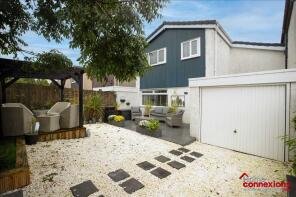
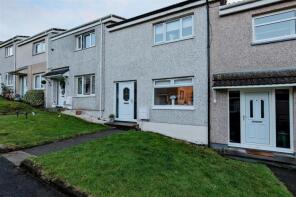
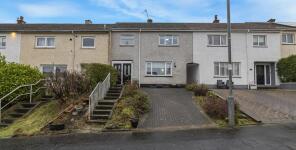
House Prices in Calderwood
House prices in Calderwood have an overall average of £130,346 over the last year.
The majority of properties sold in Calderwood during the last year were flats, selling for an average price of £81,117. Terraced properties sold for an average of £154,942, with semi-detached properties fetching £191,377.
Overall, the historical sold prices in Calderwood over the last year were 6% up on the previous year and 14% up on the 2023 peak of £114,833.
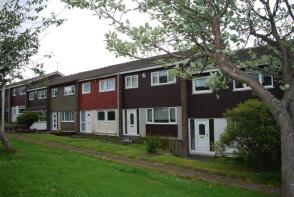
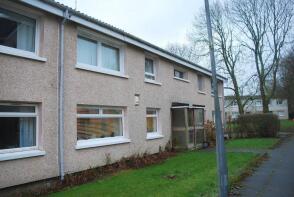
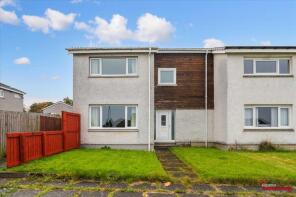
Properties Sold
82, Ballochmyle, East Kilbride, Glasgow G74 3RU
| Today | See what it's worth now |
| 29 Apr 2026 | £154,000 |
| 2 Oct 2008 | £123,000 |
No other historical records.
23, Hunters Grove, East Kilbride, Glasgow G74 3HZ
| Today | See what it's worth now |
| 27 Apr 2026 | £352,500 |
| 7 Sep 2009 | £15,000 |
No other historical records.
12, Mowbray, East Kilbride, Glasgow G74 3NW
| Today | See what it's worth now |
| 24 Apr 2026 | £87,251 |
| 30 Jul 2004 | £60,000 |
No other historical records.
119, Burns Park, East Kilbride, Glasgow G74 3EG
| Today | See what it's worth now |
| 22 Apr 2026 | £120,000 |
No other historical records.
69, Drury Lane Court, Bosworth Road, East Kilbride, Glasgow G74 3NB
| Today | See what it's worth now |
| 22 Apr 2026 | £49,000 |
| 21 Dec 2020 | £37,000 |
43, Redgrave, East Kilbride, Glasgow G74 3QY
| Today | See what it's worth now |
| 21 Apr 2026 | £103,000 |
| 26 Oct 2005 | £76,000 |
25, Ayton Park North, East Kilbride, Glasgow G74 3AX
| Today | See what it's worth now |
| 16 Apr 2026 | £87,000 |
| 2 Nov 2006 | £55,000 |
No other historical records.
7, Kenilworth, East Kilbride, Glasgow G74 3PG
| Today | See what it's worth now |
| 15 Apr 2026 | £62,500 |
| 18 Aug 2004 | £45,000 |
No other historical records.
53, Cleland Place, East Kilbride, Glasgow G74 3EL
| Today | See what it's worth now |
| 14 Apr 2026 | £230,000 |
| 6 Nov 2007 | £165,000 |
No other historical records.
48, Durward, East Kilbride, Glasgow G74 3PB
| Today | See what it's worth now |
| 9 Apr 2026 | £61,750 |
| 8 Jul 2008 | £70,000 |
26, Stobo, East Kilbride, Glasgow G74 3HL
| Today | See what it's worth now |
| 6 Apr 2026 | £102,250 |
No other historical records.
21, Ayton Park North, East Kilbride, Glasgow G74 3AX

| Today | See what it's worth now |
| 3 Apr 2026 | £115,000 |
| 22 Dec 2020 | £88,500 |
88, Ballochmyle, East Kilbride, Glasgow G74 3RU
| Today | See what it's worth now |
| 31 Mar 2026 | £159,500 |
No other historical records.
22, Salisbury, East Kilbride, Glasgow G74 3QE
| Today | See what it's worth now |
| 30 Mar 2026 | £87,000 |
| 25 Apr 2024 | £81,000 |
9, Talbot, East Kilbride, Glasgow G74 3NN
| Today | See what it's worth now |
| 26 Mar 2026 | £73,500 |
| 17 Jan 2008 | £22,000 |
38, Maxwellton Road, East Kilbride, Glasgow G74 3LU
| Today | See what it's worth now |
| 26 Mar 2026 | £86,000 |
| 24 Apr 2007 | £88,000 |
No other historical records.
19, Lochlea, East Kilbride, Glasgow G74 3RX
| Today | See what it's worth now |
| 23 Mar 2026 | £162,500 |
| 13 Sep 2019 | £99,000 |
No other historical records.
35, Stobo, East Kilbride, Glasgow G74 3HH
| Today | See what it's worth now |
| 20 Mar 2026 | £123,000 |
| 11 Feb 2014 | £68,000 |
No other historical records.
16, Mannering, East Kilbride, Glasgow G74 3PA
| Today | See what it's worth now |
| 20 Mar 2026 | £170,000 |
| 29 Jul 2025 | £90,000 |
No other historical records.
96, Stobo, East Kilbride, Glasgow G74 3HL
| Today | See what it's worth now |
| 19 Mar 2026 | £195,000 |
| 17 Nov 2022 | £190,000 |
39, Glen Clova, East Kilbride, Glasgow G74 3TB
| Today | See what it's worth now |
| 19 Mar 2026 | £180,000 |
| 8 Dec 2025 | £130,500 |
No other historical records.
63, Stratford, East Kilbride, Glasgow G74 3QJ
| Today | See what it's worth now |
| 18 Mar 2026 | £65,000 |
| 2 Feb 2018 | £46,000 |
142, Waverley, East Kilbride, Glasgow G74 3PE
| Today | See what it's worth now |
| 17 Mar 2026 | £166,000 |
No other historical records.
Source Acknowledgement: © Crown copyright. Scottish house price data is publicly available information produced by the Registers of Scotland. Material has been reproduced with the permission of the Keeper of the Registers of Scotland and contains data compiled by Registers of Scotland. For further information, please contact data@ros.gov.uk. Please note the dates shown here relate to the property's registered date not sold date.This material was last updated on 10 July 2026. It covers the period from 8 December 1987 to 30 April 2026 and contains property transactions which have been registered during that period.
Disclaimer: Rightmove.co.uk provides this Registers of Scotland data "as is". The burden for fitness of the data relies completely with the user and is provided for informational purposes only. No warranty, express or implied, is given relating to the accuracy of content of the Registers of Scotland data and Rightmove plc does not accept any liability for error or omission. If you have found an error with the data or need further information please contact data@ros.gov.uk
Permitted Use: The Registers of Scotland allows the reproduction of the data which it provides to Rightmove.co.uk free of charge in any format or medium only for research, private study or for internal circulation within an organisation. This is subject to it being reproduced accurately and not used in a misleading context. The material must be acknowledged as Crown Copyright. You are not allowed to use this information for commercial purposes, nor must you copy, distribute, sell or publish the data in any way. For any other use of this material, please apply to the Registers of Scotland for a licence. You can do this online at www.ros.gov.uk, by email at data@ros.gov.uk or by writing to Business Development, Registers of Scotland, Meadowbank House, 153 London Road, Edinburgh EH8 7AU.
Rightmove takes no liability for your use of, or reliance on, Rightmove's Instant Valuation due to the limitations of our tracking tool listed here. Use of this tool is taken entirely at your own risk. All rights reserved.