
House Prices in Calthorpe Street
House prices in Calthorpe Street have an overall average of £289,214 over the last year.
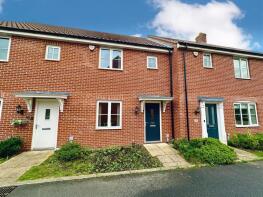
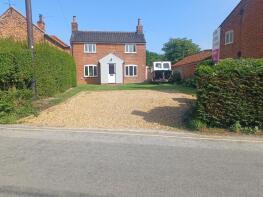
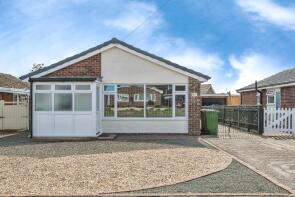
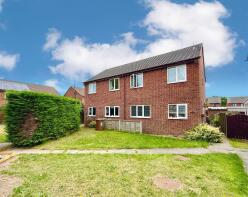
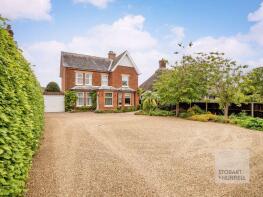
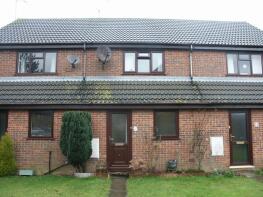
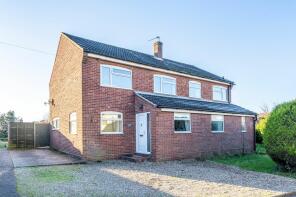
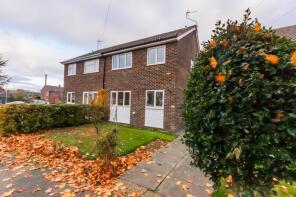
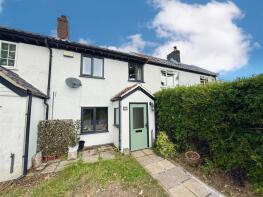
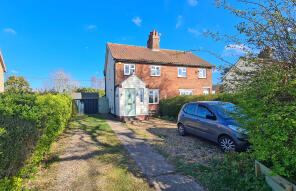
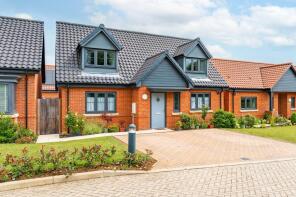
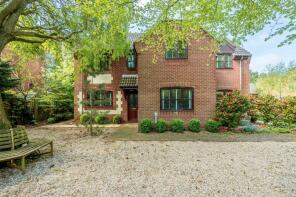
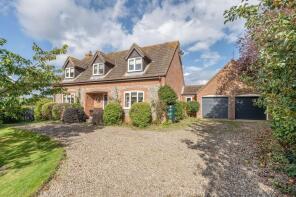
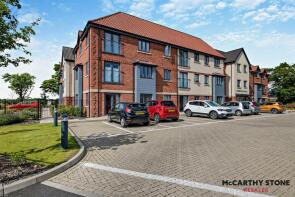
The majority of properties sold in Calthorpe Street during the last year were detached properties, selling for an average price of £439,143. Semi-detached properties sold for an average of £258,269, with terraced properties fetching £188,750.
Overall, the historical sold prices in Calthorpe Street over the last year were 14% up on the previous year and 4% up on the 2021 peak of £277,444.
Properties Sold
12, Batchelors Loke, Norwich NR12 9FR
| Today | See what it's worth now |
| 6 Mar 2026 | £205,000 |
| 21 Aug 2023 | £207,250 |
Gaydon, Lower Staithe Road, Norwich NR12 9BU
| Today | See what it's worth now |
| 5 Mar 2026 | £368,000 |
| 18 Nov 2022 | £200,000 |
No other historical records.
43, Rivermead, Norwich NR12 9PH
| Today | See what it's worth now |
| 27 Feb 2026 | £292,000 |
| 18 Apr 2024 | £180,000 |
31, Hastings Way, Norwich NR12 9RQ
| Today | See what it's worth now |
| 27 Feb 2026 | £212,000 |
| 1 Dec 2023 | £195,000 |
Straiton, Brumstead Road, Norwich NR12 9DF
| Today | See what it's worth now |
| 17 Feb 2026 | £505,000 |
| 26 Jun 1996 | £58,125 |
No other historical records.
18, Weavers Close, Stalham NR12 9EG
| Today | See what it's worth now |
| 10 Feb 2026 | £165,000 |
No other historical records.
The Grove, St Johns Road, Norwich NR12 9BE
| Today | See what it's worth now |
| 26 Jan 2026 | £490,000 |
| 19 Oct 2007 | £300,000 |
No other historical records.
Hillside House, The Hill, Yarmouth Road, Smallburgh NR12 9AD
| Today | See what it's worth now |
| 14 Jan 2026 | £335,000 |
No other historical records.
29, Ingham Road, Norwich NR12 9DR
| Today | See what it's worth now |
| 12 Jan 2026 | £236,000 |
| 17 Aug 2015 | £138,500 |
Vine Cottage, Mill Road, Norwich NR12 9BT
| Today | See what it's worth now |
| 12 Dec 2025 | £393,000 |
| 9 Jan 2019 | £335,000 |
37, Teresa Road, Norwich NR12 9EB

| Today | See what it's worth now |
| 12 Dec 2025 | £275,000 |
| 12 Jul 2018 | £230,000 |
18, St Marys Road, Norwich NR12 9DU
| Today | See what it's worth now |
| 5 Dec 2025 | £330,000 |
| 14 Oct 2016 | £148,000 |
No other historical records.
Fen View, Union Road, Smallburgh NR12 9NH
| Today | See what it's worth now |
| 4 Dec 2025 | £406,000 |
No other historical records.
5, Homestead Place, Staithe Gardens, Norwich NR12 9FZ
| Today | See what it's worth now |
| 2 Dec 2025 | £175,000 |
| 3 Mar 2022 | £189,950 |
No other historical records.
19, Ingham Road, Norwich NR12 9SD
| Today | See what it's worth now |
| 27 Nov 2025 | £270,000 |
| 18 Dec 2015 | £150,000 |
No other historical records.
39, Calthorpe Close, Norwich NR12 9EE
| Today | See what it's worth now |
| 21 Nov 2025 | £210,000 |
| 1 Aug 2007 | £136,000 |
Flat 2, St Johns Court, St Johns Road, Norwich NR12 9BF
| Today | See what it's worth now |
| 19 Nov 2025 | £120,000 |
| 22 Oct 2020 | £110,000 |
3, Wodehouse Close, Norwich NR12 9BW
| Today | See what it's worth now |
| 7 Nov 2025 | £195,000 |
| 1 Apr 2016 | £145,000 |
72, Lyndford Road, Norwich NR12 9BD

| Today | See what it's worth now |
| 6 Nov 2025 | £175,000 |
| 12 May 2020 | £147,000 |
2, Cranfield Cottages, Union Road, Norwich NR12 9NH
| Today | See what it's worth now |
| 22 Oct 2025 | £258,000 |
| 14 Jun 2019 | £212,500 |
18, Goose Lane, Norwich NR12 9SE
| Today | See what it's worth now |
| 15 Oct 2025 | £235,000 |
| 21 Dec 2015 | £172,000 |
7, Staithe Gardens, Norwich NR12 9FY
| Today | See what it's worth now |
| 3 Oct 2025 | £370,000 |
| 4 Aug 2021 | £339,950 |
No other historical records.
2 Staithe House, Albion Drive, Norwich NR12 9HF
| Today | See what it's worth now |
| 30 Sep 2025 | £440,000 |
| 17 Feb 2016 | £298,000 |
Source Acknowledgement: © Crown copyright. England and Wales house price data is publicly available information produced by the HM Land Registry.This material was last updated on 15 May 2026. It covers the period from 1 January 1995 to 31 March 2026 and contains property transactions which have been registered during that period. Contains HM Land Registry data © Crown copyright and database right 2026. This data is licensed under the Open Government Licence v3.0.
Disclaimer: Rightmove.co.uk provides this HM Land Registry data "as is". The burden for fitness of the data relies completely with the user and is provided for informational purposes only. No warranty, express or implied, is given relating to the accuracy of content of the HM Land Registry data and Rightmove does not accept any liability for error or omission. If you have found an error with the data or need further information please contact HM Land Registry.
Permitted Use: Viewers of this Information are granted permission to access this Crown copyright material and to download it onto electronic, magnetic, optical or similar storage media provided that such activities are for private research, study or in-house use only. Any other use of the material requires the formal written permission of Land Registry which can be requested from us, and is subject to an additional licence and associated charge.
Map data ©OpenStreetMap contributors.
Rightmove takes no liability for your use of, or reliance on, Rightmove's Instant Valuation due to the limitations of our tracking tool listed here. Use of this tool is taken entirely at your own risk. All rights reserved.