
House Prices in Camerton
House prices in Camerton have an overall average of £410,000 over the last year.
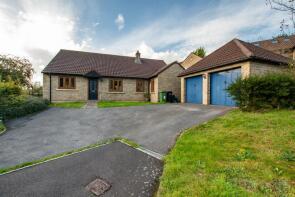
The majority of properties sold in Camerton during the last year were detached properties, selling for an average price of £815,000. Semi-detached properties sold for an average of £235,000, with terraced properties fetching £280,000.
Overall, the historical sold prices in Camerton over the last year were 13% down on the previous year and 38% down on the 2023 peak of £656,994.
Properties Sold
21, Meadgate East, Camerton, Bath BA2 0NW
| Today | See what it's worth now |
| 29 Sep 2025 | £280,000 |
| 16 Dec 2005 | £148,000 |
6, Manor Farm, Skinners Hill, Camerton, Bath BA2 0PJ
| Today | See what it's worth now |
| 18 Aug 2025 | £310,000 |
No other historical records.
35, The Daglands, Camerton, Bath BA2 0PR
| Today | See what it's worth now |
| 22 Jul 2025 | £235,000 |
No other historical records.
8, New Pit Cottages, Camerton, Bath BA2 0PE
| Today | See what it's worth now |
| 18 Jul 2025 | £815,000 |
| 14 Aug 2001 | £249,950 |
Berlena, Durcott Lane, Camerton, Bath BA2 0QE

| Today | See what it's worth now |
| 10 Jun 2025 | £825,000 |
| 1 Aug 2017 | £406,500 |
1, Canal View, Camerton, Bath BA2 0BP
| Today | See what it's worth now |
| 20 Feb 2025 | £550,000 |
| 25 Jul 2001 | £265,000 |
No other historical records.
1, East View Villas, Wick Lane, Camerton, Bath BA2 0PF
| Today | See what it's worth now |
| 12 Feb 2025 | £491,000 |
| 19 Apr 2013 | £150,000 |
No other historical records.
5, The Daglands, Camerton, Bath BA2 0PR

| Today | See what it's worth now |
| 18 Nov 2024 | £195,000 |
| 14 Oct 2005 | £120,000 |
No other historical records.
Bengrove House, Bengrove, Camerton, Bath BA2 0PH

| Today | See what it's worth now |
| 7 Nov 2024 | £740,000 |
| 8 Nov 2019 | £590,000 |
No other historical records.
The Brow, Red Hill, Camerton, Bath BA2 0NY
| Today | See what it's worth now |
| 15 Oct 2024 | £380,000 |
No other historical records.
1, The Daglands, Camerton, Bath BA2 0PR
| Today | See what it's worth now |
| 10 Oct 2024 | £205,000 |
No other historical records.
Little Oak, Red Hill, Camerton, Bath BA2 0NY
| Today | See what it's worth now |
| 9 Oct 2024 | £380,000 |
No other historical records.
13, The Daglands, Camerton, Bath BA2 0PR
| Today | See what it's worth now |
| 12 Apr 2024 | £260,000 |
| 11 Dec 2020 | £215,000 |
17, The Daglands, Camerton, Bath BA2 0PR

| Today | See what it's worth now |
| 22 Feb 2024 | £249,950 |
| 24 May 2005 | £133,000 |
No other historical records.
The Old Rectory, Rectory Lane, Camerton, Bath BA2 0PU
| Today | See what it's worth now |
| 8 Dec 2023 | £1,800,000 |
| 3 Jun 2014 | £999,999 |
No other historical records.
8, Manor Farm, Skinners Hill, Camerton, Bath BA2 0PJ
| Today | See what it's worth now |
| 4 Dec 2023 | £285,000 |
No other historical records.
Spring Cottage, Durcott Lane, Camerton, Bath BA2 0QE

| Today | See what it's worth now |
| 30 Oct 2023 | £482,500 |
| 13 Dec 2005 | £295,000 |
9, Manor Farm, Skinners Hill, Camerton, Bath BA2 0PJ
| Today | See what it's worth now |
| 26 Oct 2023 | £199,950 |
No other historical records.
Valley View, Hook, Timsbury, Bath BA2 0NE
| Today | See what it's worth now |
| 1 Sep 2023 | £340,000 |
| 18 Sep 2020 | £310,000 |
Purbeck House, Bridge Place Road, Camerton, Bath BA2 0PD

| Today | See what it's worth now |
| 23 Aug 2023 | £810,000 |
| 6 Aug 2004 | £400,000 |
No other historical records.
Bramley Cottage, Durcott Lane, Camerton, Bath BA2 0QE

| Today | See what it's worth now |
| 27 Jun 2023 | £728,500 |
No other historical records.
Homelands, Camerton Hill, Camerton, Bath BA2 0PS

| Today | See what it's worth now |
| 26 May 2023 | £610,000 |
| 19 Aug 1998 | £136,550 |
25, Meadgate East, Camerton, Bath BA2 0NW
| Today | See what it's worth now |
| 16 Dec 2022 | £485,000 |
| 29 Jan 2018 | £362,000 |
No other historical records.

Source Acknowledgement: © Crown copyright. England and Wales house price data is publicly available information produced by the HM Land Registry.This material was last updated on 9 July 2026. It covers the period from 1 January 1995 to 30 April 2026 and contains property transactions which have been registered during that period. Contains HM Land Registry data © Crown copyright and database right 2026. This data is licensed under the Open Government Licence v3.0.
Disclaimer: Rightmove.co.uk provides this HM Land Registry data "as is". The burden for fitness of the data relies completely with the user and is provided for informational purposes only. No warranty, express or implied, is given relating to the accuracy of content of the HM Land Registry data and Rightmove does not accept any liability for error or omission. If you have found an error with the data or need further information please contact HM Land Registry.
Permitted Use: Viewers of this Information are granted permission to access this Crown copyright material and to download it onto electronic, magnetic, optical or similar storage media provided that such activities are for private research, study or in-house use only. Any other use of the material requires the formal written permission of Land Registry which can be requested from us, and is subject to an additional licence and associated charge.
Rightmove takes no liability for your use of, or reliance on, Rightmove's Instant Valuation due to the limitations of our tracking tool listed here. Use of this tool is taken entirely at your own risk. All rights reserved.