
House Prices in Carbrook
House prices in Carbrook have an overall average of £103,368 over the last year.
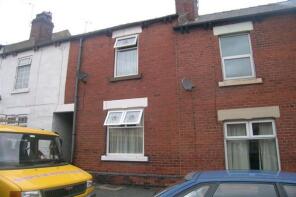
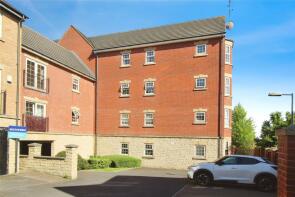
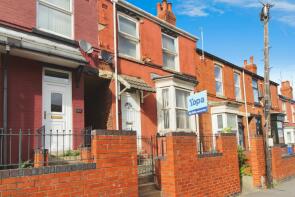
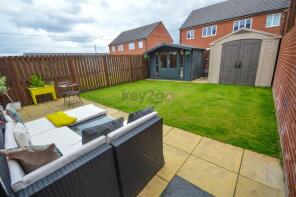
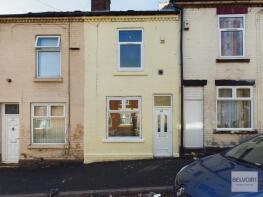
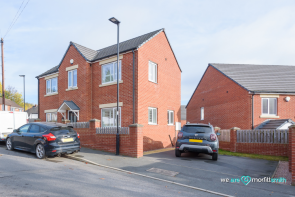
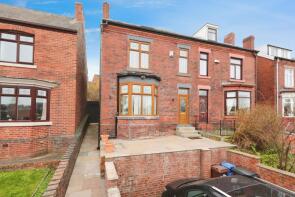
The majority of properties sold in Carbrook during the last year were terraced properties, selling for an average price of £91,167. Semi-detached properties sold for an average of £129,500, with flats fetching £93,000.
Overall, the historical sold prices in Carbrook over the last year were 1% up on the previous year and 4% up on the 2017 peak of £99,275.
Properties Sold
81, Robey Street, Sheffield S4 8JE
| Today | See what it's worth now |
| 19 Mar 2026 | £65,000 |
| 4 Nov 2010 | £68,000 |
3, 28 City View, Holywell Heights, Sheffield S4 8AG
| Today | See what it's worth now |
| 20 Feb 2026 | £93,000 |
| 28 Mar 2007 | £133,000 |
No other historical records.
91, Skelwith Road, Sheffield S4 8AY
| Today | See what it's worth now |
| 2 Feb 2026 | £122,000 |
| 28 Jul 2000 | £26,300 |
No other historical records.
52, Wade Street, Sheffield S4 8HW
| Today | See what it's worth now |
| 14 Jan 2026 | £70,000 |
No other historical records.
138, Popple Street, Sheffield S4 8JJ

| Today | See what it's worth now |
| 21 Nov 2025 | £60,000 |
| 13 Sep 2024 | £37,000 |
109, Skelwith Road, Sheffield S4 8AY
| Today | See what it's worth now |
| 7 Nov 2025 | £100,000 |
| 29 Apr 2005 | £45,000 |
No other historical records.
86, Skelwith Road, Sheffield S4 8AY
| Today | See what it's worth now |
| 30 Oct 2025 | £235,000 |
| 28 Sep 2018 | £149,995 |
No other historical records.
69, Wade Street, Sheffield S4 8HW
| Today | See what it's worth now |
| 3 Oct 2025 | £83,000 |
No other historical records.
93, Whiteways Road, Sheffield S4 8EW
| Today | See what it's worth now |
| 30 Sep 2025 | £162,000 |
| 6 Jan 1995 | £37,500 |
No other historical records.
55, Whiteways Road, Sheffield S4 8EW

| Today | See what it's worth now |
| 5 Sep 2025 | £70,000 |
| 5 Sep 2025 | £70,000 |
150, Wensley Street, Sheffield S4 8HN
| Today | See what it's worth now |
| 3 Sep 2025 | £125,000 |
| 4 Jan 2002 | £32,000 |
No other historical records.
148, Wensley Street, Sheffield S4 8HN
| Today | See what it's worth now |
| 3 Sep 2025 | £115,000 |
| 4 Jan 2002 | £32,000 |
No other historical records.
2, Farcroft Grove, Sheffield S4 8BP

| Today | See what it's worth now |
| 29 Aug 2025 | £128,000 |
| 30 Apr 2021 | £118,000 |
5, Hawkshead Road, Sheffield S4 8BB
| Today | See what it's worth now |
| 15 Aug 2025 | £50,000 |
No other historical records.
407, Earl Marshal Road, Sheffield S4 8FB
| Today | See what it's worth now |
| 14 Aug 2025 | £100,000 |
| 20 Nov 2001 | £30,750 |
No other historical records.
391, Earl Marshal Road, Sheffield S4 8FB
| Today | See what it's worth now |
| 31 Jul 2025 | £106,000 |
No other historical records.
94, Lloyd Street, Sheffield S4 8JB
| Today | See what it's worth now |
| 25 Jul 2025 | £80,000 |
No other historical records.
57, Whiteways Grove, Sheffield S4 8FL
| Today | See what it's worth now |
| 7 Jul 2025 | £130,000 |
| 2 Sep 2022 | £126,000 |
Apartment 5, 1 Holywell Gardens, Holywell Heights, Sheffield S4 8AU

| Today | See what it's worth now |
| 27 Jun 2025 | £97,000 |
| 11 Apr 2008 | £113,750 |
No other historical records.
4, 11 Lower Holywell, Holywell Heights, Sheffield S4 8AU
| Today | See what it's worth now |
| 27 Jun 2025 | £100,000 |
| 12 Dec 2005 | £110,950 |
No other historical records.
82, Willoughby Street, Sheffield S4 8HT
| Today | See what it's worth now |
| 18 Jun 2025 | £71,000 |
| 30 Oct 2003 | £31,500 |
No other historical records.
114, Popple Street, Sheffield S4 8JJ
| Today | See what it's worth now |
| 30 May 2025 | £45,000 |
| 23 Feb 2021 | £51,000 |
No other historical records.
14, Brathay Road, Sheffield S4 8AW
| Today | See what it's worth now |
| 30 May 2025 | £243,000 |
| 9 Nov 2018 | £167,500 |
No other historical records.

Source Acknowledgement: © Crown copyright. England and Wales house price data is publicly available information produced by the HM Land Registry.This material was last updated on 9 July 2026. It covers the period from 1 January 1995 to 30 April 2026 and contains property transactions which have been registered during that period. Contains HM Land Registry data © Crown copyright and database right 2026. This data is licensed under the Open Government Licence v3.0.
Disclaimer: Rightmove.co.uk provides this HM Land Registry data "as is". The burden for fitness of the data relies completely with the user and is provided for informational purposes only. No warranty, express or implied, is given relating to the accuracy of content of the HM Land Registry data and Rightmove does not accept any liability for error or omission. If you have found an error with the data or need further information please contact HM Land Registry.
Permitted Use: Viewers of this Information are granted permission to access this Crown copyright material and to download it onto electronic, magnetic, optical or similar storage media provided that such activities are for private research, study or in-house use only. Any other use of the material requires the formal written permission of Land Registry which can be requested from us, and is subject to an additional licence and associated charge.
Rightmove takes no liability for your use of, or reliance on, Rightmove's Instant Valuation due to the limitations of our tracking tool listed here. Use of this tool is taken entirely at your own risk. All rights reserved.