
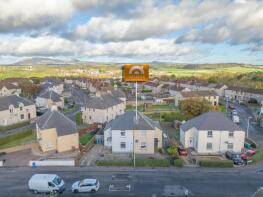
House Prices in Cardenden
House prices in Cardenden have an overall average of £182,754 over the last year.
The majority of properties sold in Cardenden during the last year were semi-detached properties, selling for an average price of £144,545. Detached properties sold for an average of £317,167, with terraced properties fetching £125,887.
Overall, the historical sold prices in Cardenden over the last year were 40% up on the previous year and 22% up on the 2021 peak of £149,330.
Properties Sold
9 The Bairns, Woodend Road, Auchterderran, Lochgelly KY5 0NE
| Today | See what it's worth now |
| 24 Apr 2026 | £461,000 |
| 23 Jun 2021 | £365,000 |
No other historical records.
4, Jamphlars Place, Bowhill, Lochgelly KY5 0NT

| Today | See what it's worth now |
| 23 Apr 2026 | £278,000 |
| 3 Aug 2009 | £183,000 |
No other historical records.
8, Jamphlars Place, Bowhill, Lochgelly KY5 0NT
| Today | See what it's worth now |
| 14 Apr 2026 | £252,000 |
| 19 Apr 2023 | £212,000 |
12, Wallsgreen Gardens, Bowhill, Lochgelly KY5 0BH
| Today | See what it's worth now |
| 9 Apr 2026 | £140,000 |
| 7 Dec 2020 | £81,000 |
71, Bluebell Gardens, Dundonald, Lochgelly KY5 0DS
| Today | See what it's worth now |
| 25 Mar 2026 | £230,000 |
| 4 Mar 2011 | £125,000 |
174, Carden Castle Park, Lochgelly KY5 0ED
| Today | See what it's worth now |
| 12 Mar 2026 | £125,000 |
| 3 Mar 2006 | £36,570 |
No other historical records.
31, Bowhill View, Bowhill, Lochgelly KY5 0NP
| Today | See what it's worth now |
| 6 Mar 2026 | £220,000 |
| 18 Sep 2020 | £140,000 |
88, Carden Castle Park, Lochgelly KY5 0EF
| Today | See what it's worth now |
| 2 Mar 2026 | £147,000 |
| 7 Aug 2017 | £105,000 |
No other historical records.
33, Woodend Road, Auchterderran, Cardenden KY5 0NH
| Today | See what it's worth now |
| 2 Mar 2026 | £210,000 |
No other historical records.
15, Main Road, Dundonald, Lochgelly KY5 0DJ
| Today | See what it's worth now |
| 19 Feb 2026 | £240,000 |
| 24 Feb 2006 | £125,000 |
Harestanes Farm, Strathruddie, Kinglassie KY5 0HF
| Today | See what it's worth now |
| 2 Feb 2026 | £505,000 |
No other historical records.
139, Dundonald Park, Dundonald, Lochgelly KY5 0DA
| Today | See what it's worth now |
| 2 Feb 2026 | £126,000 |
| 1 May 2023 | £90,000 |
81, Station Road, Bowhill, Lochgelly KY5 0BW

| Today | See what it's worth now |
| 30 Jan 2026 | £305,000 |
| 27 Oct 2022 | £220,000 |
No other historical records.
12, Muirtonhill Road, Auchterderran, Cardenden KY5 0NN
| Today | See what it's worth now |
| 21 Jan 2026 | £86,750 |
No other historical records.
106, Station Road, Bowhill, Lochgelly KY5 0BW
| Today | See what it's worth now |
| 13 Jan 2026 | £103,900 |
| 22 Oct 2013 | £53,000 |
149, Carden Castle Park, Lochgelly KY5 0EB
| Today | See what it's worth now |
| 12 Jan 2026 | £96,999 |
| 20 Feb 2023 | £96,000 |
14, Balgreggie Road, Auchterderran, Lochgelly KY5 0NF
| Today | See what it's worth now |
| 17 Dec 2025 | £125,000 |
| 8 Mar 2023 | £110,000 |
No other historical records.
Whitehall Cottage, Cardenden Road, Cardenden KY5 0PL
| Today | See what it's worth now |
| 15 Dec 2025 | £235,000 |
No other historical records.
214, Carden Avenue, Lochgelly KY5 0EN
| Today | See what it's worth now |
| 8 Dec 2025 | £148,500 |
| 23 Nov 2016 | £84,000 |
75, Main Street, Bowhill, Cardenden KY5 0NA
| Today | See what it's worth now |
| 1 Dec 2025 | £55,000 |
No other historical records.
6, Orebank Road, Bowhill, Cardenden KY5 0JW
| Today | See what it's worth now |
| 4 Nov 2025 | £130,000 |
No other historical records.
11, Balgreggie Park, Auchterderran, Lochgelly KY5 0NQ
| Today | See what it's worth now |
| 3 Nov 2025 | £126,000 |
| 31 Jan 2022 | £110,000 |
30, Carden Mill Brae, Lochgelly KY5 0BB
| Today | See what it's worth now |
| 31 Oct 2025 | £209,000 |
| 11 Mar 2022 | £165,000 |
No other historical records.
Source Acknowledgement: © Crown copyright. Scottish house price data is publicly available information produced by the Registers of Scotland. Material has been reproduced with the permission of the Keeper of the Registers of Scotland and contains data compiled by Registers of Scotland. For further information, please contact data@ros.gov.uk. Please note the dates shown here relate to the property's registered date not sold date.This material was last updated on 10 July 2026. It covers the period from 8 December 1987 to 30 April 2026 and contains property transactions which have been registered during that period.
Disclaimer: Rightmove.co.uk provides this Registers of Scotland data "as is". The burden for fitness of the data relies completely with the user and is provided for informational purposes only. No warranty, express or implied, is given relating to the accuracy of content of the Registers of Scotland data and Rightmove plc does not accept any liability for error or omission. If you have found an error with the data or need further information please contact data@ros.gov.uk
Permitted Use: The Registers of Scotland allows the reproduction of the data which it provides to Rightmove.co.uk free of charge in any format or medium only for research, private study or for internal circulation within an organisation. This is subject to it being reproduced accurately and not used in a misleading context. The material must be acknowledged as Crown Copyright. You are not allowed to use this information for commercial purposes, nor must you copy, distribute, sell or publish the data in any way. For any other use of this material, please apply to the Registers of Scotland for a licence. You can do this online at www.ros.gov.uk, by email at data@ros.gov.uk or by writing to Business Development, Registers of Scotland, Meadowbank House, 153 London Road, Edinburgh EH8 7AU.
Rightmove takes no liability for your use of, or reliance on, Rightmove's Instant Valuation due to the limitations of our tracking tool listed here. Use of this tool is taken entirely at your own risk. All rights reserved.