
House Prices in Castle Goring
House prices in Castle Goring have an overall average of £422,288 over the last year.
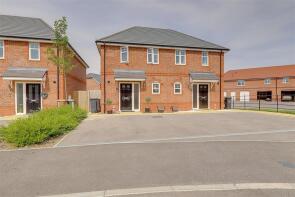
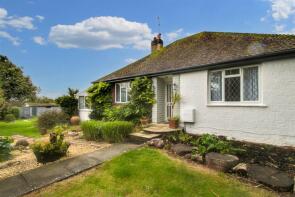
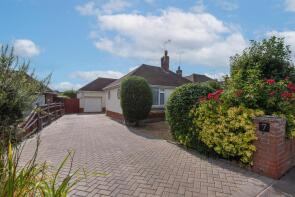
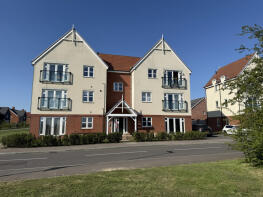
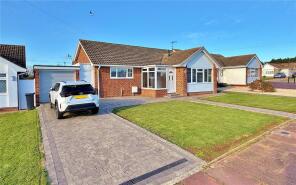
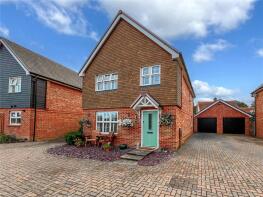
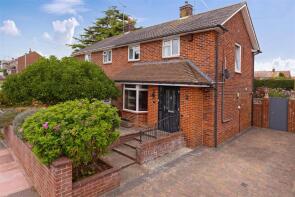
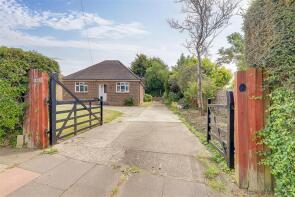
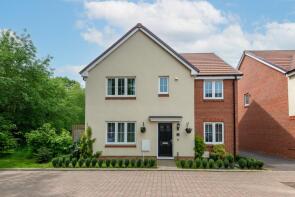
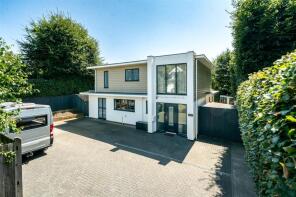
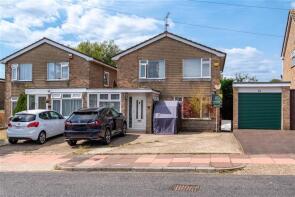
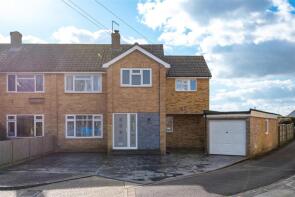
The majority of properties sold in Castle Goring during the last year were detached properties, selling for an average price of £536,800. Semi-detached properties sold for an average of £349,216, with terraced properties fetching £352,962.
Overall, the historical sold prices in Castle Goring over the last year were similar to the previous year and 5% up on the 2021 peak of £404,074.
Properties Sold
8, Dianthus Grove, Northbrook, Worthing BN13 3ZA
| Today | See what it's worth now |
| 20 Mar 2026 | £337,000 |
| 9 Dec 2022 | £332,000 |
No other historical records.
47, Ivydore Avenue, Durrington, Worthing BN13 3JH
| Today | See what it's worth now |
| 12 Mar 2026 | £455,000 |
| 3 Jun 2016 | £390,000 |
7, Exmoor Drive, Salvington, Worthing BN13 2PH
| Today | See what it's worth now |
| 11 Mar 2026 | £435,000 |
| 15 Nov 2019 | £380,000 |
No other historical records.
Flat 6, 1 Ramsons House, Snapdragon Lane, Northbrook, Worthing BN13 3GJ
| Today | See what it's worth now |
| 6 Mar 2026 | £180,000 |
| 21 Dec 2018 | £175,000 |
No other historical records.
8, Stour Close, Durrington, Worthing BN13 3LZ
| Today | See what it's worth now |
| 2 Mar 2026 | £435,000 |
| 22 Nov 2011 | £235,000 |
1, Zinnia Row, Northbrook, Worthing BN13 3GT
| Today | See what it's worth now |
| 27 Feb 2026 | £450,000 |
| 29 Mar 2018 | £370,000 |
No other historical records.
56, Ivydore Avenue, Durrington, Worthing BN13 3JA
| Today | See what it's worth now |
| 26 Feb 2026 | £340,000 |
| 13 Sep 2018 | £260,000 |
No other historical records.
48, Salvington Hill, Salvington, Worthing BN13 3AZ
| Today | See what it's worth now |
| 23 Feb 2026 | £435,000 |
| 4 Jul 2013 | £250,000 |
No other historical records.
52, Lobelia Drive, Northbrook, Worthing BN13 3GL
| Today | See what it's worth now |
| 20 Feb 2026 | £575,000 |
| 22 Dec 2017 | £389,950 |
No other historical records.
10a, Arundel Road, Salvington, Worthing BN13 3EG
| Today | See what it's worth now |
| 20 Feb 2026 | £625,000 |
| 18 May 2012 | £415,000 |
No other historical records.
19, Ivydore Avenue, Durrington, Worthing BN13 3JD
| Today | See what it's worth now |
| 20 Feb 2026 | £395,000 |
| 17 Aug 2006 | £230,000 |
8, Tyne Close, Durrington, Worthing BN13 3NG
| Today | See what it's worth now |
| 13 Feb 2026 | £575,000 |
| 6 Feb 1996 | £95,000 |
No other historical records.
12, Broadview Gardens, Salvington, Worthing BN13 3DZ
| Today | See what it's worth now |
| 13 Feb 2026 | £480,000 |
| 24 Jun 2011 | £285,000 |
20, Stour Road, Durrington, Worthing BN13 3LY
| Today | See what it's worth now |
| 9 Feb 2026 | £430,000 |
| 15 Dec 1995 | £87,500 |
No other historical records.
Briar Croft, Crockhurst Hill, Salvington, Worthing BN13 3EE
| Today | See what it's worth now |
| 6 Feb 2026 | £625,000 |
| 28 Apr 2017 | £530,000 |
6, Mersey Road, Durrington, Worthing BN13 3NQ
| Today | See what it's worth now |
| 3 Feb 2026 | £337,000 |
| 16 Jul 1999 | £108,950 |
No other historical records.
7, Tyne Close, Durrington, Worthing BN13 3NG
| Today | See what it's worth now |
| 29 Jan 2026 | £442,500 |
No other historical records.
30, West Way, Salvington, Worthing BN13 3AY
| Today | See what it's worth now |
| 23 Jan 2026 | £525,000 |
| 5 Sep 1997 | £175,000 |
No other historical records.
70, New Road, Durrington, Worthing BN13 3JJ
| Today | See what it's worth now |
| 21 Jan 2026 | £299,915 |
| 6 Oct 2017 | £272,000 |
Flat 5, 1 Ramsons House, Snapdragon Lane, Northbrook, Worthing BN13 3GJ

| Today | See what it's worth now |
| 15 Jan 2026 | £245,000 |
| 21 Dec 2018 | £219,950 |
No other historical records.
16, Exmoor Crescent, Salvington, Worthing BN13 2PL
| Today | See what it's worth now |
| 15 Jan 2026 | £480,000 |
| 12 Dec 2023 | £407,500 |
47, 4 Columbia House, Romany Road, Northbrook, Worthing BN13 3YR
| Today | See what it's worth now |
| 9 Jan 2026 | £143,000 |
| 19 Jul 2022 | £160,000 |
No other historical records.
92, New Road, Durrington, Worthing BN13 3JL
| Today | See what it's worth now |
| 9 Jan 2026 | £330,000 |
| 31 Aug 2011 | £208,500 |
Source Acknowledgement: © Crown copyright. England and Wales house price data is publicly available information produced by the HM Land Registry.This material was last updated on 15 May 2026. It covers the period from 1 January 1995 to 31 March 2026 and contains property transactions which have been registered during that period. Contains HM Land Registry data © Crown copyright and database right 2026. This data is licensed under the Open Government Licence v3.0.
Disclaimer: Rightmove.co.uk provides this HM Land Registry data "as is". The burden for fitness of the data relies completely with the user and is provided for informational purposes only. No warranty, express or implied, is given relating to the accuracy of content of the HM Land Registry data and Rightmove does not accept any liability for error or omission. If you have found an error with the data or need further information please contact HM Land Registry.
Permitted Use: Viewers of this Information are granted permission to access this Crown copyright material and to download it onto electronic, magnetic, optical or similar storage media provided that such activities are for private research, study or in-house use only. Any other use of the material requires the formal written permission of Land Registry which can be requested from us, and is subject to an additional licence and associated charge.
Rightmove takes no liability for your use of, or reliance on, Rightmove's Instant Valuation due to the limitations of our tracking tool listed here. Use of this tool is taken entirely at your own risk. All rights reserved.