
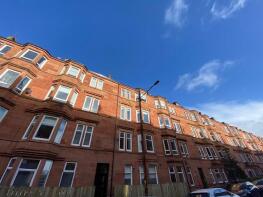
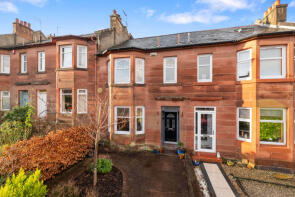
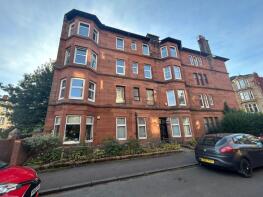
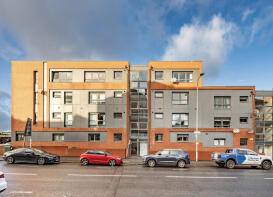
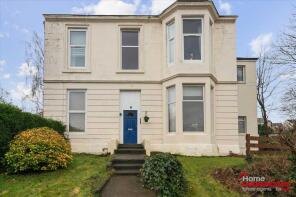
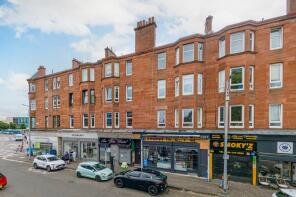
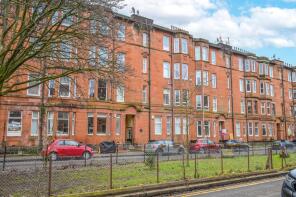
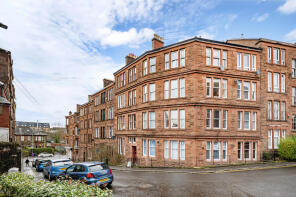
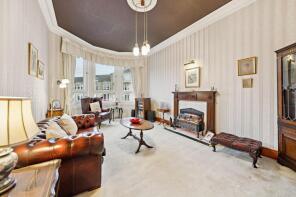
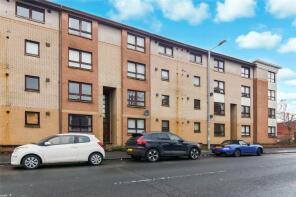
House Prices in Cathcart
House prices in Cathcart have an overall average of £234,531 over the last year.
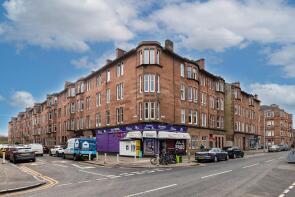
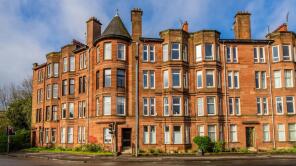
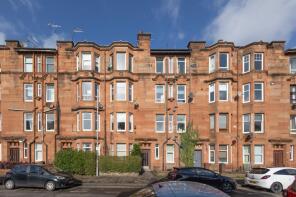
The majority of properties sold in Cathcart during the last year were flats, selling for an average price of £187,474. Semi-detached properties sold for an average of £363,816, with terraced properties fetching £377,440.
Overall, the historical sold prices in Cathcart over the last year were 2% up on the previous year and 12% up on the 2023 peak of £209,536.
Properties Sold
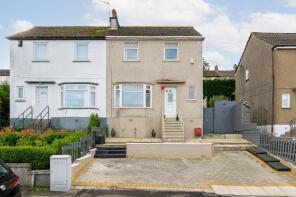
55, Shetland Drive, Glasgow G44 5DS
| Today | See what it's worth now |
| 30 Apr 2026 | £236,500 |
| 29 Aug 2006 | £145,000 |
No other historical records.
Flat 3/2, 137, Sinclair Drive, Glasgow G42 9SN
| Today | See what it's worth now |
| 30 Apr 2026 | £215,000 |
| 21 Mar 2022 | £160,000 |
Flat 0/1, 182, Kings Park Road, Glasgow G44 4SU
| Today | See what it's worth now |
| 30 Apr 2026 | £206,000 |
| 16 Jan 2023 | £138,000 |
No other historical records.
Flat 2/1, 74, Dundrennan Road, Glasgow G42 9SG

| Today | See what it's worth now |
| 30 Apr 2026 | £278,640 |
| 19 Nov 2019 | £170,000 |
Flat 2/2, 14, Garry Street, Glasgow G44 4AY
| Today | See what it's worth now |
| 29 Apr 2026 | £128,500 |
No other historical records.
Flat 0/3, 182, Newlands Road, Glasgow G44 4ET
| Today | See what it's worth now |
| 29 Apr 2026 | £80,000 |
No other historical records.
Flat 2/3, 85, Tankerland Road, Glasgow G44 4EW

| Today | See what it's worth now |
| 28 Apr 2026 | £147,000 |
No other historical records.
Flat 3/1, 14, Cartside Street, Glasgow G42 9TF
| Today | See what it's worth now |
| 27 Apr 2026 | £167,000 |
| 11 Jul 2013 | £70,000 |
Flat 0/1, 140, Lochleven Road, Glasgow G42 9SQ
| Today | See what it's worth now |
| 27 Apr 2026 | £313,300 |
| 12 Oct 2020 | £227,071 |
Flat 6/2, 80, Inverlair Avenue, Glasgow G43 2BD
| Today | See what it's worth now |
| 27 Apr 2026 | £291,500 |
No other historical records.
Flat 2/1, 47, Cartvale Road, Glasgow G42 9RP
| Today | See what it's worth now |
| 27 Apr 2026 | £206,750 |
| 20 Jul 2018 | £154,000 |
42, Kintore Road, Glasgow G43 2HA

| Today | See what it's worth now |
| 27 Apr 2026 | £525,000 |
No other historical records.
Flat 3/2, 9, Overdale Street, Glasgow G42 9PZ
| Today | See what it's worth now |
| 27 Apr 2026 | £318,700 |
| 23 Dec 2020 | £207,500 |
6, Woodlinn Avenue, Glasgow G44 5TX
| Today | See what it's worth now |
| 23 Apr 2026 | £447,756 |
| 3 Aug 2018 | £281,600 |
Flat 2/2, 240, Ledard Road, Glasgow G42 9RQ
| Today | See what it's worth now |
| 22 Apr 2026 | £90,000 |
| 23 Jul 2025 | £135,000 |
Flat 6, The Oaks, Millholm Road, Glasgow G44 3YQ
| Today | See what it's worth now |
| 22 Apr 2026 | £267,500 |
| 8 Oct 2018 | £168,100 |
No other historical records.
Flat 0/2, 214, Clarkston Road, Glasgow G44 3DN
| Today | See what it's worth now |
| 21 Apr 2026 | £190,000 |
No other historical records.
96, Craig Road, Glasgow G44 3AW
| Today | See what it's worth now |
| 20 Apr 2026 | £190,000 |
| 1 Nov 2024 | £135,100 |
Flat 1/2, 11, Sinclair Drive, Glasgow G42 9PR
| Today | See what it's worth now |
| 17 Apr 2026 | £235,000 |
| 2 Sep 2024 | £138,000 |
Flat 0/2, 19, Rannoch Street, Glasgow G44 4DE
| Today | See what it's worth now |
| 16 Apr 2026 | £93,500 |
| 9 Jun 2020 | £65,500 |
Flat 3/3, 41, Holmhead Place, Glasgow G44 4HE
| Today | See what it's worth now |
| 15 Apr 2026 | £156,800 |
| 6 Jul 2016 | £92,000 |
Flat 3/2, 21, Craig Road, Glasgow G44 3DW
| Today | See what it's worth now |
| 14 Apr 2026 | £151,115 |
No other historical records.
Flat 0/1, 50, Cartside Street, Glasgow G42 9TG

| Today | See what it's worth now |
| 14 Apr 2026 | £146,500 |
| 1 Aug 2017 | £78,000 |
Source Acknowledgement: © Crown copyright. Scottish house price data is publicly available information produced by the Registers of Scotland. Material has been reproduced with the permission of the Keeper of the Registers of Scotland and contains data compiled by Registers of Scotland. For further information, please contact data@ros.gov.uk. Please note the dates shown here relate to the property's registered date not sold date.This material was last updated on 10 July 2026. It covers the period from 8 December 1987 to 30 April 2026 and contains property transactions which have been registered during that period.
Disclaimer: Rightmove.co.uk provides this Registers of Scotland data "as is". The burden for fitness of the data relies completely with the user and is provided for informational purposes only. No warranty, express or implied, is given relating to the accuracy of content of the Registers of Scotland data and Rightmove plc does not accept any liability for error or omission. If you have found an error with the data or need further information please contact data@ros.gov.uk
Permitted Use: The Registers of Scotland allows the reproduction of the data which it provides to Rightmove.co.uk free of charge in any format or medium only for research, private study or for internal circulation within an organisation. This is subject to it being reproduced accurately and not used in a misleading context. The material must be acknowledged as Crown Copyright. You are not allowed to use this information for commercial purposes, nor must you copy, distribute, sell or publish the data in any way. For any other use of this material, please apply to the Registers of Scotland for a licence. You can do this online at www.ros.gov.uk, by email at data@ros.gov.uk or by writing to Business Development, Registers of Scotland, Meadowbank House, 153 London Road, Edinburgh EH8 7AU.
Rightmove takes no liability for your use of, or reliance on, Rightmove's Instant Valuation due to the limitations of our tracking tool listed here. Use of this tool is taken entirely at your own risk. All rights reserved.