
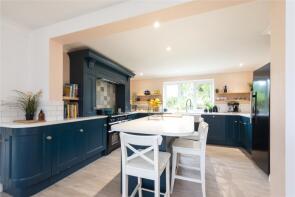
House Prices in Cattistock
House prices in Cattistock have an overall average of £397,800 over the last year.
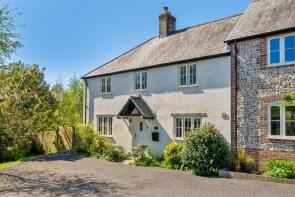
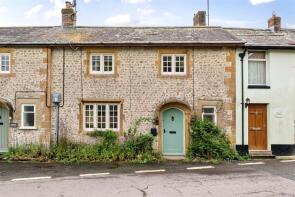
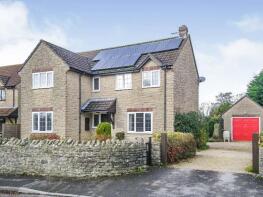
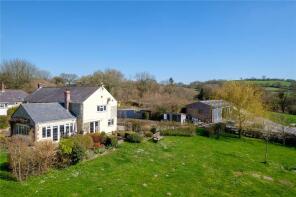
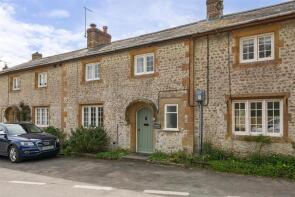
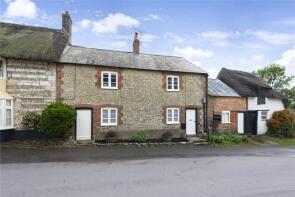
The majority of properties sold in Cattistock during the last year were terraced properties, selling for an average price of £403,500. Detached properties sold for an average of £375,000.
Overall, the historical sold prices in Cattistock over the last year were 15% up on the previous year and 34% down on the 2023 peak of £601,080.
Properties Sold
Saddle House, The Stableyard, Duck Street, Dorchester DT2 0JH
| Today | See what it's worth now |
| 9 Jan 2026 | £375,000 |
| 17 Jun 2021 | £360,000 |
No other historical records.
Horseshoe House, The Stableyard, Duck Street, Dorchester DT2 0JH
| Today | See what it's worth now |
| 14 Nov 2025 | £475,000 |
| 22 Nov 2018 | £375,000 |
No other historical records.
Jasmine Cottage, The Square, Cattistock DT2 0JD
| Today | See what it's worth now |
| 30 Oct 2025 | £266,500 |
No other historical records.
9, Rectory Gardens, South Drive, Dorchester DT2 0FD
| Today | See what it's worth now |
| 19 Sep 2025 | £362,500 |
| 24 Feb 2017 | £303,000 |
754, The Square, Dorchester DT2 0JD
| Today | See what it's worth now |
| 25 Jul 2025 | £510,000 |
| 30 Sep 2021 | £429,000 |
No other historical records.
Vyes Corner, The Square, Cattistock DT2 0JD
| Today | See what it's worth now |
| 20 Jun 2025 | £322,500 |
No other historical records.
Orchard End, Meadow View, Cattistock DT2 0JF
| Today | See what it's worth now |
| 8 May 2025 | £407,500 |
No other historical records.
11, Rectory Gardens, South Drive, Dorchester DT2 0FD
| Today | See what it's worth now |
| 27 Mar 2025 | £342,000 |
| 29 Jun 2016 | £300,000 |
Wingberry, Beech Tree Close, Cattistock DT2 0JN
| Today | See what it's worth now |
| 20 Mar 2025 | £335,000 |
No other historical records.
6, Rectory Gardens, South Drive, Dorchester DT2 0FD
| Today | See what it's worth now |
| 24 Jan 2025 | £132,000 |
| 14 Apr 2022 | £108,000 |
No other historical records.
752, The Square, Dorchester DT2 0JD
| Today | See what it's worth now |
| 20 Jan 2025 | £490,000 |
| 2 Aug 2001 | £246,700 |
Daisy Cottage, Sandhills, Dorchester DT2 0HQ
| Today | See what it's worth now |
| 7 Oct 2024 | £385,000 |
| 6 Oct 2017 | £315,000 |
Ivy Cottage, The Square, Dorchester DT2 0JD

| Today | See what it's worth now |
| 8 Feb 2024 | £385,000 |
| 20 Nov 2015 | £232,000 |
1, Greylands, Dorchester DT2 0HZ

| Today | See what it's worth now |
| 7 Feb 2024 | £525,000 |
| 14 Oct 2020 | £355,000 |
No other historical records.
Rivendell Cottage, Manor Farm, Dorchester DT2 0JJ

| Today | See what it's worth now |
| 14 Dec 2023 | £508,000 |
No other historical records.
4, West End, Dorchester DT2 0JA

| Today | See what it's worth now |
| 30 Oct 2023 | £550,000 |
| 14 Jun 2019 | £320,000 |
No other historical records.
Rockforge, Duck Street, Dorchester DT2 0JH
| Today | See what it's worth now |
| 31 Aug 2023 | £615,000 |
| 27 Apr 2018 | £420,000 |
No other historical records.
Peace And Plenty, Sandhills, Dorchester DT2 0HQ
| Today | See what it's worth now |
| 25 Jul 2023 | £1,012,400 |
| 10 Sep 2008 | £610,000 |
No other historical records.
Virginia Cottage, The Square, Cattistock DT2 0JD
| Today | See what it's worth now |
| 12 May 2023 | £320,000 |
No other historical records.
763, The Square, Dorchester DT2 0JD
| Today | See what it's worth now |
| 25 Nov 2022 | £540,000 |
| 8 Jun 2017 | £295,000 |
No other historical records.
3, West End, Dorchester DT2 0JA

| Today | See what it's worth now |
| 9 Nov 2022 | £450,000 |
No other historical records.
Manor Farmhouse, Manor Farm, Dorchester DT2 0JJ

| Today | See what it's worth now |
| 28 Sep 2022 | £880,000 |
| 2 Sep 2014 | £687,500 |
No other historical records.
Castle Cottage, The Square, Dorchester DT2 0JH

| Today | See what it's worth now |
| 15 Aug 2022 | £410,000 |
| 2 Jul 2007 | £295,000 |

Source Acknowledgement: © Crown copyright. England and Wales house price data is publicly available information produced by the HM Land Registry.This material was last updated on 9 July 2026. It covers the period from 1 January 1995 to 30 April 2026 and contains property transactions which have been registered during that period. Contains HM Land Registry data © Crown copyright and database right 2026. This data is licensed under the Open Government Licence v3.0.
Disclaimer: Rightmove.co.uk provides this HM Land Registry data "as is". The burden for fitness of the data relies completely with the user and is provided for informational purposes only. No warranty, express or implied, is given relating to the accuracy of content of the HM Land Registry data and Rightmove does not accept any liability for error or omission. If you have found an error with the data or need further information please contact HM Land Registry.
Permitted Use: Viewers of this Information are granted permission to access this Crown copyright material and to download it onto electronic, magnetic, optical or similar storage media provided that such activities are for private research, study or in-house use only. Any other use of the material requires the formal written permission of Land Registry which can be requested from us, and is subject to an additional licence and associated charge.
Rightmove takes no liability for your use of, or reliance on, Rightmove's Instant Valuation due to the limitations of our tracking tool listed here. Use of this tool is taken entirely at your own risk. All rights reserved.