
House Prices in CB21
House prices in CB21 have an overall average of £517,490 over the last year.
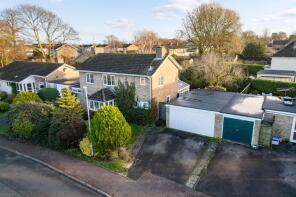
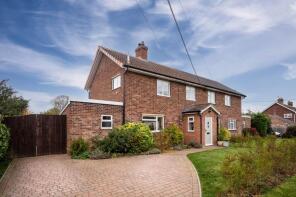
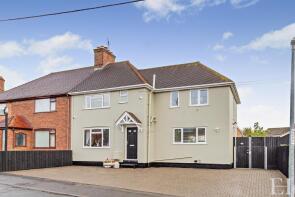
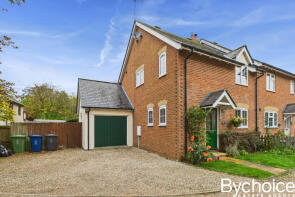
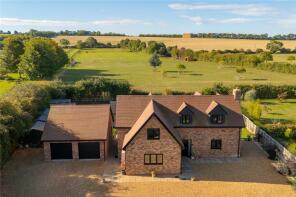
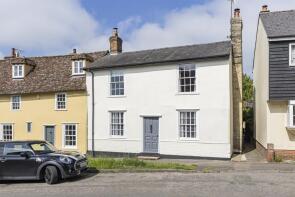
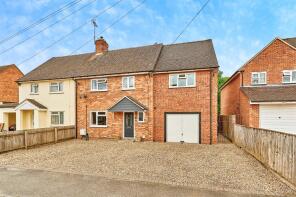
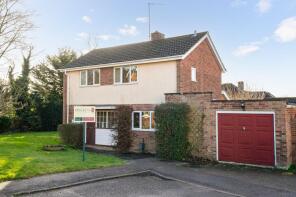
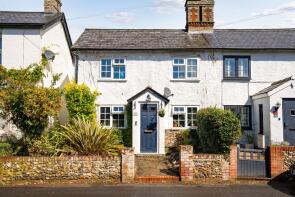
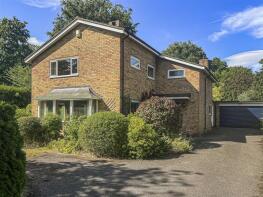
The majority of properties sold in CB21 during the last year were detached properties, selling for an average price of £707,203. Semi-detached properties sold for an average of £413,960, with terraced properties fetching £351,610.
Overall, the historical sold prices in CB21 over the last year were 4% down on the previous year and 9% down on the 2022 peak of £567,686.
Properties Sold
2, The Rookery, Cambridge CB21 4EU
| Today | See what it's worth now |
| 21 Apr 2026 | £458,500 |
| 28 Mar 2008 | £370,000 |
1, Claydon Close, Cambridge CB21 4TD
| Today | See what it's worth now |
| 17 Apr 2026 | £375,000 |
| 10 Jun 2015 | £230,000 |
No other historical records.
26, Hillway, Cambridge CB21 4JE
| Today | See what it's worth now |
| 10 Apr 2026 | £425,000 |
| 25 Oct 2017 | £420,000 |
Extensions and planning permission in CB21
See planning approval stats, extension build costs and value added estimates.

1, Crossways, Cambridge CB21 4TT
| Today | See what it's worth now |
| 2 Apr 2026 | £335,000 |
| 20 May 1999 | £103,500 |
No other historical records.
14, Princes Close, Cambridge CB21 4EE

| Today | See what it's worth now |
| 1 Apr 2026 | £438,000 |
| 25 Apr 2016 | £387,500 |
30, Palmers Close, Cambridge CB21 4JA
| Today | See what it's worth now |
| 27 Mar 2026 | £215,000 |
| 1 Apr 2021 | £195,000 |
13, Brinkman Road, Cambridge CB21 4XF
| Today | See what it's worth now |
| 27 Mar 2026 | £282,500 |
| 14 Aug 2015 | £265,000 |
Cutting Lodge, Cutting Road, Cambridge CB21 6AJ
| Today | See what it's worth now |
| 23 Mar 2026 | £450,000 |
| 19 Sep 2014 | £325,000 |
No other historical records.
Bardsfield, Walden Road, Cambridge CB21 4NX
| Today | See what it's worth now |
| 20 Mar 2026 | £635,000 |
| 10 Dec 2014 | £545,000 |
25, Mays Avenue, Cambridge CB21 4ER
| Today | See what it's worth now |
| 20 Mar 2026 | £375,000 |
| 13 Nov 2015 | £290,000 |
4, Dotterell Hall Barns, Cambridge Road, Cambridge CB21 4AQ
| Today | See what it's worth now |
| 16 Mar 2026 | £775,000 |
| 4 Aug 2020 | £760,000 |
No other historical records.
71, Caraway Road, Cambridge CB21 5DU
| Today | See what it's worth now |
| 12 Mar 2026 | £620,000 |
| 12 Oct 2007 | £198,000 |
No other historical records.
36, Windmill Lane, Cambridge CB21 5DT
| Today | See what it's worth now |
| 12 Mar 2026 | £520,000 |
| 29 Nov 2013 | £354,950 |
No other historical records.
5, Wheatsheaf Way, Cambridge CB21 4XB
| Today | See what it's worth now |
| 20 Feb 2026 | £340,000 |
| 9 Jun 2023 | £335,000 |
No other historical records.
22, Kingfisher Walk, Cambridge CB21 4UA

| Today | See what it's worth now |
| 20 Feb 2026 | £395,000 |
| 7 Aug 1998 | £85,000 |
No other historical records.
12, Coles Lane, Cambridge CB21 4JS
| Today | See what it's worth now |
| 17 Feb 2026 | £360,000 |
| 22 Nov 2022 | £350,000 |
9, Hayter Close, Cambridge CB21 5LY
| Today | See what it's worth now |
| 13 Feb 2026 | £265,000 |
| 10 Nov 2015 | £182,000 |
No other historical records.
3, Green Hill Mews, Cambridge CB21 4JN
| Today | See what it's worth now |
| 13 Feb 2026 | £220,000 |
| 12 Nov 2021 | £190,000 |
No other historical records.
22b Meadow View, South Road, Cambridge CB21 6AU
| Today | See what it's worth now |
| 6 Feb 2026 | £965,000 |
| 11 Nov 2021 | £450,000 |
No other historical records.
5, Coles Lane, Cambridge CB21 4JS
| Today | See what it's worth now |
| 6 Feb 2026 | £367,500 |
| 4 Jan 2013 | £250,000 |
11, Rivey Way, Cambridge CB21 4LH
| Today | See what it's worth now |
| 6 Feb 2026 | £525,000 |
| 20 Oct 2005 | £190,000 |
No other historical records.
2, Beech Way, Cambridge CB21 4LA
| Today | See what it's worth now |
| 2 Feb 2026 | £315,000 |
| 5 Apr 2017 | £297,500 |
No other historical records.
4, The Furrells, Linton CB21 4JJ
| Today | See what it's worth now |
| 2 Feb 2026 | £475,000 |
No other historical records.
Source Acknowledgement: © Crown copyright. England and Wales house price data is publicly available information produced by the HM Land Registry.This material was last updated on 9 July 2026. It covers the period from 1 January 1995 to 30 April 2026 and contains property transactions which have been registered during that period. Contains HM Land Registry data © Crown copyright and database right 2026. This data is licensed under the Open Government Licence v3.0.
Disclaimer: Rightmove.co.uk provides this HM Land Registry data "as is". The burden for fitness of the data relies completely with the user and is provided for informational purposes only. No warranty, express or implied, is given relating to the accuracy of content of the HM Land Registry data and Rightmove does not accept any liability for error or omission. If you have found an error with the data or need further information please contact HM Land Registry.
Permitted Use: Viewers of this Information are granted permission to access this Crown copyright material and to download it onto electronic, magnetic, optical or similar storage media provided that such activities are for private research, study or in-house use only. Any other use of the material requires the formal written permission of Land Registry which can be requested from us, and is subject to an additional licence and associated charge.
Rightmove takes no liability for your use of, or reliance on, Rightmove's Instant Valuation due to the limitations of our tracking tool listed here. Use of this tool is taken entirely at your own risk. All rights reserved.