House Prices in Babraham Road, Sawston, Cambridge, Cambridgeshire, CB22
House prices in Babraham Road have an overall average of £435,875 over the last year.
Overall, the historical sold prices in Babraham Road over the last year were 9% up on the previous year and 18% down on the 2017 peak of £530,000.
Properties Sold
115, Babraham Road, Sawston, Cambridge CB22 3FP

| Today | See what it's worth now |
| 2 Sep 2024 | £430,750 |
| 8 Mar 2021 | £412,950 |
No other historical records.
43, Babraham Road, Sawston CB22 3DQ

| Today | See what it's worth now |
| 30 Aug 2024 | £441,000 |
No other historical records.
50, Babraham Road, Sawston, Cambridge CB22 3LH
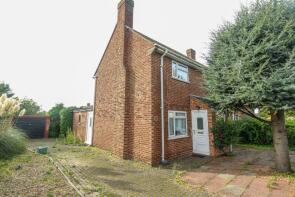
| Today | See what it's worth now |
| 3 Jun 2024 | £410,000 |
No other historical records.
47, Babraham Road, Sawston, Cambridge CB22 3DQ
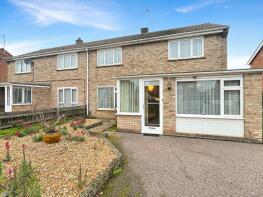
| Today | See what it's worth now |
| 15 Mar 2024 | £405,000 |
No other historical records.
54, Babraham Road, Sawston, Cambridge CB22 3LH
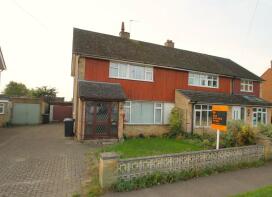
| Today | See what it's worth now |
| 9 Feb 2024 | £387,500 |
No other historical records.
18, Babraham Road, Sawston, Cambridge CB22 3DQ
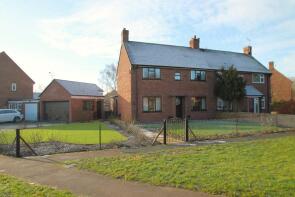
| Today | See what it's worth now |
| 23 Jun 2023 | £435,000 |
No other historical records.
23, Babraham Road, Sawston, Cambridge CB22 3DQ
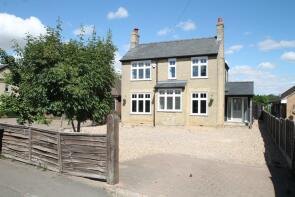
| Today | See what it's worth now |
| 22 Feb 2023 | £910,000 |
| 15 Dec 2015 | £555,000 |
No other historical records.
97, Babraham Road, Sawston, Cambridge CB22 3FP

| Today | See what it's worth now |
| 15 Dec 2022 | £459,950 |
No other historical records.
95, Babraham Road, Sawston, Cambridge CB22 3FP

| Today | See what it's worth now |
| 12 Dec 2022 | £459,950 |
No other historical records.
93, Babraham Road, Sawston, Cambridge CB22 3FP

| Today | See what it's worth now |
| 1 Dec 2022 | £469,950 |
No other historical records.
99, Babraham Road, Sawston, Cambridge CB22 3FP

| Today | See what it's worth now |
| 29 Nov 2022 | £469,950 |
No other historical records.
107, Babraham Road, Sawston, Cambridge CB22 3FP

| Today | See what it's worth now |
| 30 Sep 2022 | £399,950 |
No other historical records.
109, Babraham Road, Sawston, Cambridge CB22 3FP

| Today | See what it's worth now |
| 23 Sep 2022 | £384,950 |
No other historical records.
111, Babraham Road, Sawston, Cambridge CB22 3FP

| Today | See what it's worth now |
| 15 Sep 2022 | £384,950 |
No other historical records.
31, Babraham Road, Sawston, Cambridge CB22 3DQ
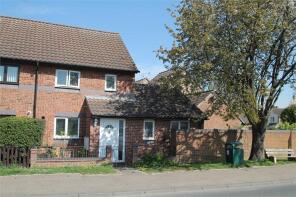
| Today | See what it's worth now |
| 13 Sep 2022 | £420,000 |
| 16 Sep 2016 | £350,000 |
113, Babraham Road, Sawston, Cambridge CB22 3FP

| Today | See what it's worth now |
| 2 Sep 2022 | £394,950 |
No other historical records.
1, Babraham Road, Sawston, Cambridge CB22 3DQ

| Today | See what it's worth now |
| 25 Jul 2022 | £675,000 |
No other historical records.
41, Babraham Road, Sawston, Cambridge CB22 3DQ

| Today | See what it's worth now |
| 27 May 2022 | £500,000 |
| 27 May 2022 | £500,000 |
82, Babraham Road, Sawston, Cambridge CB22 3LH
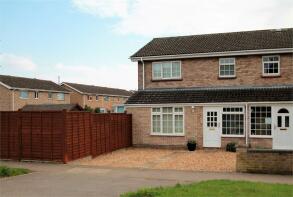
| Today | See what it's worth now |
| 12 May 2022 | £417,500 |
| 31 Jul 1997 | £75,000 |
No other historical records.
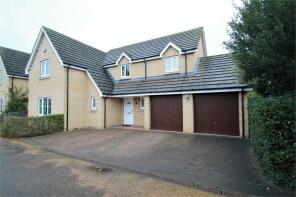
1b, Babraham Road, Sawston, Cambridge CB22 3DQ
| Today | See what it's worth now |
| 8 Apr 2022 | £660,000 |
| 12 Jun 2006 | £340,000 |
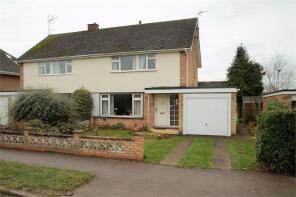
64, Babraham Road, Sawston, Cambridge CB22 3LH
| Today | See what it's worth now |
| 11 Mar 2022 | £405,000 |
| 2 Jul 1996 | £77,500 |
No other historical records.
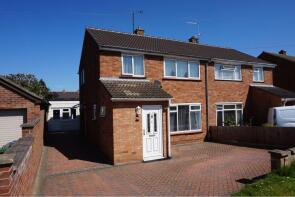
37, Babraham Road, Sawston, Cambridge CB22 3DQ
| Today | See what it's worth now |
| 9 Dec 2021 | £460,000 |
| 1 Aug 2018 | £390,000 |
49, Babraham Road, Sawston, Cambridge CB22 3DQ

| Today | See what it's worth now |
| 24 Jun 2021 | £395,000 |
No other historical records.
67, Babraham Road, Sawston, Cambridge CB22 3DD

| Today | See what it's worth now |
| 4 Jun 2021 | £590,000 |
| 7 Aug 2015 | £322,500 |
No other historical records.
123, Babraham Road, Sawston, Cambridge CB22 3FP

| Today | See what it's worth now |
| 29 Apr 2021 | £407,400 |
No other historical records.
Find out how much your property is worth
The following agents can provide you with a free, no-obligation valuation. Simply select the ones you'd like to hear from.
Sponsored
All featured agents have paid a fee to promote their valuation expertise.

haart
Bar Hill

Arkwright & Co
Cambridge

Tucker Gardner
Great Shelford

Cooke Curtis & Co
Cambridge

Alexander Greens
Cambridge

Bidwells
Cambridge
Get ready with a Mortgage in Principle
- Personalised result in just 20 minutes
- Find out how much you can borrow
- Get viewings faster with agents
- No impact on your credit score
What's your property worth?
Source Acknowledgement: © Crown copyright. England and Wales house price data is publicly available information produced by the HM Land Registry.This material was last updated on 16 July 2025. It covers the period from 1 January 1995 to 30 May 2025 and contains property transactions which have been registered during that period. Contains HM Land Registry data © Crown copyright and database right 2025. This data is licensed under the Open Government Licence v3.0.
Disclaimer: Rightmove.co.uk provides this HM Land Registry data "as is". The burden for fitness of the data relies completely with the user and is provided for informational purposes only. No warranty, express or implied, is given relating to the accuracy of content of the HM Land Registry data and Rightmove does not accept any liability for error or omission. If you have found an error with the data or need further information please contact HM Land Registry.
Permitted Use: Viewers of this Information are granted permission to access this Crown copyright material and to download it onto electronic, magnetic, optical or similar storage media provided that such activities are for private research, study or in-house use only. Any other use of the material requires the formal written permission of Land Registry which can be requested from us, and is subject to an additional licence and associated charge.
Data on planning applications, home extensions and build costs is provided by Resi.co.uk. Planning data is calculated using the last 2 years of residential applications within the selected planning authority. Home extension data, such as build costs and project timelines, are calculated using approximately 9,000 architectural projects Resi has completed, and 23,500 builders quotes submitted via Resi's platform. Build costs are adjusted according to inflation rates to more accurately represent today's prices.
Map data ©OpenStreetMap contributors.
Rightmove takes no liability for your use of, or reliance on, Rightmove's Instant Valuation due to the limitations of our tracking tool listed here. Use of this tool is taken entirely at your own risk. All rights reserved.
