
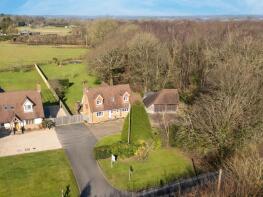
House Prices in Challock
House prices in Challock have an overall average of £581,688 over the last year.
The majority of properties sold in Challock during the last year were detached properties, selling for an average price of £694,500. Semi-detached properties sold for an average of £445,000, with terraced properties fetching £291,000.
Overall, the historical sold prices in Challock over the last year were 17% down on the previous year and 15% down on the 2022 peak of £682,320.
Properties Sold
17, High Snoad Wood, Ashford TN25 4DQ
| Today | See what it's worth now |
| 6 Mar 2026 | £590,000 |
| 5 Jul 1996 | £131,000 |
No other historical records.
Berisal, Buck Street, Ashford TN25 4AR
| Today | See what it's worth now |
| 16 Feb 2026 | £822,500 |
| 26 Mar 2021 | £352,000 |
No other historical records.
The Lodge Biggin Farm, Faversham Road, Ashford TN25 4BG
| Today | See what it's worth now |
| 9 Jan 2026 | £785,000 |
| 23 Mar 2011 | £273,500 |
No other historical records.
2, Chestnut Cottage, Buck Street, Ashford TN25 4AT
| Today | See what it's worth now |
| 24 Nov 2025 | £291,000 |
| 3 Jul 2015 | £215,500 |
2, Chapmans Close, Challock TN25 4AX
| Today | See what it's worth now |
| 17 Oct 2025 | £325,000 |
No other historical records.
Wood Dene, Canterbury Road, Ashford TN25 4BB
| Today | See what it's worth now |
| 18 Sep 2025 | £825,000 |
| 27 Oct 2004 | £348,000 |
Palma, Canterbury Road, Ashford TN25 4BP
| Today | See what it's worth now |
| 8 Aug 2025 | £565,000 |
| 10 Dec 2021 | £570,000 |
No other historical records.
Yew Tree Cottage, Green Lane, Ashford TN25 4DN

| Today | See what it's worth now |
| 30 Jul 2025 | £450,000 |
| 29 Sep 2020 | £385,000 |
Willow House, Westwell Lane, Ashford TN25 4FE
| Today | See what it's worth now |
| 30 May 2025 | £730,000 |
| 1 Oct 2018 | £720,000 |
No other historical records.
Leeway, Canterbury Road, Ashford TN25 4DL
| Today | See what it's worth now |
| 25 Mar 2025 | £670,000 |
| 26 Nov 2020 | £650,000 |
No other historical records.
3, Paddock View, Faversham Road, Ashford TN25 4BQ
| Today | See what it's worth now |
| 14 Mar 2025 | £540,000 |
| 29 Nov 2019 | £425,000 |
No other historical records.
1, White Cottage, Church Lane, Ashford TN25 4BS

| Today | See what it's worth now |
| 7 Mar 2025 | £410,000 |
| 28 May 2010 | £214,600 |
Forest Lodge, Buck Street, Ashford TN25 4AR
| Today | See what it's worth now |
| 17 Jan 2025 | £670,000 |
| 6 Jan 2020 | £630,000 |
No other historical records.
Ardingly House, Old Clockhouse Green, Challock, Ashford TN25 4FQ
| Today | See what it's worth now |
| 3 Jan 2025 | £900,000 |
No other historical records.
5, The Ransleys, Mill Lane, Ashford TN25 4FP
| Today | See what it's worth now |
| 13 Dec 2024 | £760,000 |
| 17 Mar 2022 | £775,000 |
No other historical records.
Pear Tree Cottage, Pested Lane, Challock TN25 4BE
| Today | See what it's worth now |
| 11 Dec 2024 | £570,000 |
No other historical records.
The Alders, Old Clockhouse Green, Challock, Ashford TN25 4FQ
| Today | See what it's worth now |
| 10 Dec 2024 | £627,500 |
No other historical records.
Meadowcroft, Green Lane, Challock TN25 4BL

| Today | See what it's worth now |
| 6 Dec 2024 | £445,000 |
No other historical records.
Nitida, Buck Street, Ashford TN25 4AR

| Today | See what it's worth now |
| 2 Dec 2024 | £600,000 |
| 1 Apr 1997 | £132,000 |
No other historical records.
Darcy House, Old Clockhouse Green, Challock, Ashford TN25 4FQ
| Today | See what it's worth now |
| 31 Oct 2024 | £980,000 |
No other historical records.
11, High Snoad Wood, Ashford TN25 4DQ
| Today | See what it's worth now |
| 11 Oct 2024 | £620,000 |
| 1 Sep 2003 | £378,000 |
8, Clevedon Court, Ashford TN25 4BW
| Today | See what it's worth now |
| 27 Sep 2024 | £660,000 |
| 30 Jun 2021 | £665,000 |
Sunset Cottage, Old Clockhouse Green, Challock, Ashford TN25 4FQ
| Today | See what it's worth now |
| 27 Sep 2024 | £675,000 |
No other historical records.
Source Acknowledgement: © Crown copyright. England and Wales house price data is publicly available information produced by the HM Land Registry.This material was last updated on 9 July 2026. It covers the period from 1 January 1995 to 30 April 2026 and contains property transactions which have been registered during that period. Contains HM Land Registry data © Crown copyright and database right 2026. This data is licensed under the Open Government Licence v3.0.
Disclaimer: Rightmove.co.uk provides this HM Land Registry data "as is". The burden for fitness of the data relies completely with the user and is provided for informational purposes only. No warranty, express or implied, is given relating to the accuracy of content of the HM Land Registry data and Rightmove does not accept any liability for error or omission. If you have found an error with the data or need further information please contact HM Land Registry.
Permitted Use: Viewers of this Information are granted permission to access this Crown copyright material and to download it onto electronic, magnetic, optical or similar storage media provided that such activities are for private research, study or in-house use only. Any other use of the material requires the formal written permission of Land Registry which can be requested from us, and is subject to an additional licence and associated charge.
Rightmove takes no liability for your use of, or reliance on, Rightmove's Instant Valuation due to the limitations of our tracking tool listed here. Use of this tool is taken entirely at your own risk. All rights reserved.