
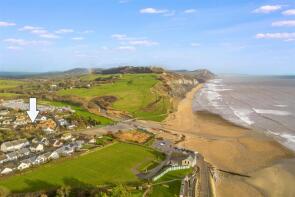
House Prices in Champernhayes Marsh
House prices in Champernhayes Marsh have an overall average of £468,817 over the last year.
The majority of properties sold in Champernhayes Marsh during the last year were detached properties, selling for an average price of £607,251. Terraced properties sold for an average of £276,438, with semi-detached properties fetching £396,875.
Overall, the historical sold prices in Champernhayes Marsh over the last year were 10% down on the previous year and 16% down on the 2023 peak of £555,642.
Properties Sold
Morcombe Farm House, Main Road, Bridport DT6 6DY
| Today | See what it's worth now |
| 9 Apr 2026 | £640,000 |
| 27 May 2011 | £587,500 |
Flat 6, Little Tea Gardens, Lower Sea Lane, Bridport DT6 6LR
| Today | See what it's worth now |
| 30 Mar 2026 | £297,500 |
| 31 Mar 2016 | £235,000 |
Site Of Little Croft, Meadow Way, Bridport DT6 6NS
| Today | See what it's worth now |
| 24 Mar 2026 | £620,000 |
| 11 Apr 2012 | £250,000 |
Ashton Cottage, Main Street, Bridport DT6 6JE
| Today | See what it's worth now |
| 20 Mar 2026 | £200,000 |
| 21 Jan 2000 | £84,950 |
Little Winford, Mill Lane, Bridport DT6 6JS
| Today | See what it's worth now |
| 18 Mar 2026 | £690,000 |
| 6 Dec 2002 | £398,500 |
No other historical records.
Long Reef, Charberry Rise, Bridport DT6 6BN
| Today | See what it's worth now |
| 17 Mar 2026 | £795,000 |
| 3 Jul 2020 | £581,500 |
The Lodge, Star Lane, Morcombelake DT6 6DN
| Today | See what it's worth now |
| 6 Mar 2026 | £329,000 |
| 31 Jan 1996 | £112,000 |
No other historical records.
Bullen Side, Sun Lane, Bridport DT6 6DL
| Today | See what it's worth now |
| 6 Feb 2026 | £760,000 |
| 12 Jul 2012 | £460,000 |
13, Wesley Close, Charmouth DT6 6QT
| Today | See what it's worth now |
| 29 Jan 2026 | £260,000 |
No other historical records.
1, Bilberry Close, Bridport DT6 6JB
| Today | See what it's worth now |
| 22 Jan 2026 | £330,000 |
| 10 May 2002 | £186,000 |
1, The Seahorse, Higher Sea Lane, Bridport DT6 6BB
| Today | See what it's worth now |
| 16 Jan 2026 | £252,000 |
| 5 Oct 2007 | £200,000 |
16, Fernhill Heights, Fernhill, Bridport DT6 6AU
| Today | See what it's worth now |
| 12 Jan 2026 | £90,000 |
| 15 Apr 2016 | £71,000 |
No other historical records.
4, Georges Close, Bridport DT6 6RU
| Today | See what it's worth now |
| 18 Dec 2025 | £470,000 |
| 27 Jan 2014 | £330,000 |
5, Mill View, The Street, Bridport DT6 6QJ

| Today | See what it's worth now |
| 21 Nov 2025 | £320,000 |
| 19 Nov 1999 | £60,000 |
No other historical records.
The Forge, Grandfathers Knap, Bridport DT6 6NW
| Today | See what it's worth now |
| 5 Nov 2025 | £955,016 |
| 18 Oct 2005 | £575,000 |
8, Arundell, Bridport DT6 6RY
| Today | See what it's worth now |
| 3 Nov 2025 | £375,000 |
| 1 Jun 2020 | £295,000 |
Greenways, Ryall Road, Bridport DT6 6EN
| Today | See what it's worth now |
| 13 Oct 2025 | £420,000 |
| 30 Apr 1996 | £116,000 |
No other historical records.
Maindy Cottage, Old Lyme Hill, Bridport DT6 6BP
| Today | See what it's worth now |
| 30 Sep 2025 | £370,000 |
| 22 Dec 1999 | £137,000 |
No other historical records.
3, Pump Cottages, West Road, Bridport DT6 6AE
| Today | See what it's worth now |
| 22 Sep 2025 | £392,500 |
| 25 May 2012 | £170,000 |
Partway Cottage, Spence Lane, Bridport DT6 6DG
| Today | See what it's worth now |
| 19 Sep 2025 | £695,000 |
| 27 Aug 2015 | £470,000 |
No other historical records.
Hollyhocks, The Street, Bridport DT6 6QE
| Today | See what it's worth now |
| 19 Sep 2025 | £592,000 |
| 5 May 2017 | £455,000 |
Knapp Cottage, Main Road, Bridport DT6 6DY
| Today | See what it's worth now |
| 12 Sep 2025 | £450,000 |
| 28 Aug 1998 | £135,000 |
Tanglewood House, Ryall Road, Bridport DT6 6EG
| Today | See what it's worth now |
| 21 Aug 2025 | £700,000 |
| 9 Dec 2016 | £540,000 |
Source Acknowledgement: © Crown copyright. England and Wales house price data is publicly available information produced by the HM Land Registry.This material was last updated on 9 July 2026. It covers the period from 1 January 1995 to 30 April 2026 and contains property transactions which have been registered during that period. Contains HM Land Registry data © Crown copyright and database right 2026. This data is licensed under the Open Government Licence v3.0.
Disclaimer: Rightmove.co.uk provides this HM Land Registry data "as is". The burden for fitness of the data relies completely with the user and is provided for informational purposes only. No warranty, express or implied, is given relating to the accuracy of content of the HM Land Registry data and Rightmove does not accept any liability for error or omission. If you have found an error with the data or need further information please contact HM Land Registry.
Permitted Use: Viewers of this Information are granted permission to access this Crown copyright material and to download it onto electronic, magnetic, optical or similar storage media provided that such activities are for private research, study or in-house use only. Any other use of the material requires the formal written permission of Land Registry which can be requested from us, and is subject to an additional licence and associated charge.
Rightmove takes no liability for your use of, or reliance on, Rightmove's Instant Valuation due to the limitations of our tracking tool listed here. Use of this tool is taken entirely at your own risk. All rights reserved.