
House Prices in Chapelgate
House prices in Chapelgate have an overall average of £225,673 over the last year.
The majority of properties sold in Chapelgate during the last year were detached properties, selling for an average price of £269,381. Semi-detached properties sold for an average of £191,302, with terraced properties fetching £146,043.
Overall, the historical sold prices in Chapelgate over the last year were 7% down on the previous year and 3% down on the 2022 peak of £233,508.
Properties Sold
62 Oldgate Dairy, St James Road, Long Sutton, Spalding PE12 9AZ
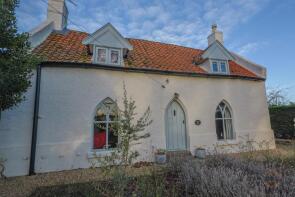
| Today | See today's value |
| 20 Aug 2026 | £345,000 |
| 14 Feb 1997 | £85,500 |
No other historical records.
6, King Street, Sutton Bridge, Spalding PE12 9RB
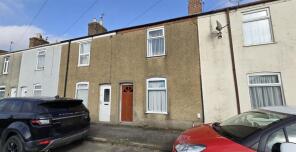
| Today | See today's value |
| 18 Aug 2026 | £110,000 |
No other historical records.
206, New Road, Sutton Bridge, Spalding PE12 9QE
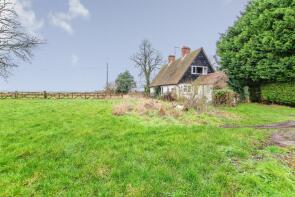
| Today | See today's value |
| 14 Aug 2026 | £310,000 |
| 14 Sep 2007 | £230,000 |
No other historical records.
53, Woodlands, Long Sutton, Spalding PE12 9LY
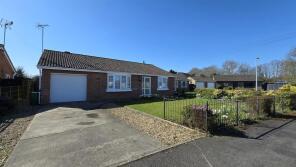
| Today | See today's value |
| 13 Aug 2026 | £254,000 |
| 27 Aug 2009 | £174,000 |
26, Daniels Gate, Long Sutton, Spalding PE12 9DP
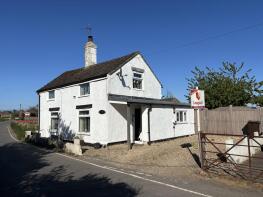
| Today | See today's value |
| 10 Aug 2026 | £165,000 |
| 31 Jan 2018 | £110,000 |
Edward Villa, Main Road, Gedney Drove End, Spalding PE12 9PD
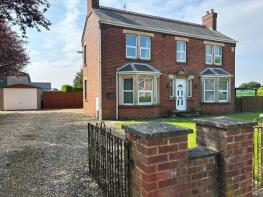
| Today | See today's value |
| 3 Aug 2026 | £206,000 |
No other historical records.
8, Lancaster Drive, Long Sutton, Spalding PE12 9BD
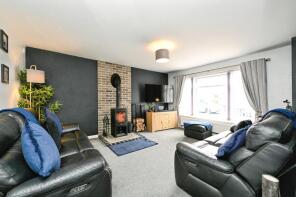
| Today | See today's value |
| 3 Aug 2026 | £335,000 |
| 29 Aug 2014 | £185,000 |
17, Midsummer Gardens, Long Sutton, Spalding PE12 9GF
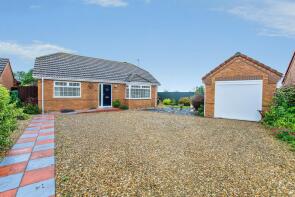
| Today | See today's value |
| 3 Aug 2026 | £260,000 |
| 30 May 2000 | £74,950 |
No other historical records.
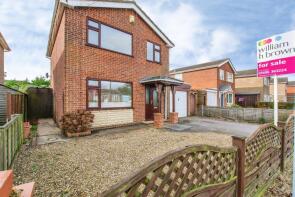
21, Dick Turpin Way, Long Sutton, Spalding PE12 9EP
| Today | See today's value |
| 30 Jul 2026 | £165,000 |
| 21 Sep 2018 | £223,000 |
No other historical records.
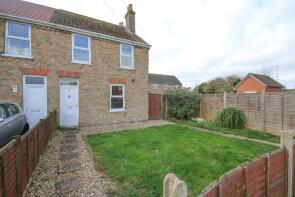
101, Bridge Road, Sutton Bridge, Spalding PE12 9SD
| Today | See today's value |
| 30 Jul 2026 | £155,000 |
| 26 Jan 2007 | £117,250 |
No other historical records.
2, Sir Peter Scott Road, Sutton Bridge, Spalding PE12 9SE
| Today | See today's value |
| 29 Jul 2026 | £230,000 |
| 15 Aug 2014 | £151,000 |
No other historical records.
13, Little London, Long Sutton, Spalding PE12 9LE

| Today | See today's value |
| 27 Jul 2026 | £206,500 |
| 29 Sep 2023 | £152,000 |
No other historical records.
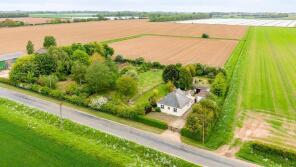
Puddle Paddock, Blackbarn Road, Gedney Drove End, Spalding PE12 9NE
| Today | See today's value |
| 24 Jul 2026 | £315,000 |
| 26 Apr 2023 | £350,000 |
9, Chestnut Terrace, Sutton Bridge, Spalding PE12 9SX
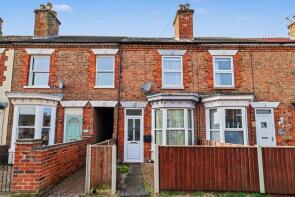
| Today | See today's value |
| 24 Jul 2026 | £140,000 |
| 7 Feb 2020 | £110,000 |
5, Highgrove, Long Sutton, Spalding PE12 9ER

| Today | See today's value |
| 24 Jul 2026 | £205,000 |
| 1 Jul 1996 | £46,000 |
No other historical records.
6, Dunlin Drive, Long Sutton, Spalding PE12 9RR
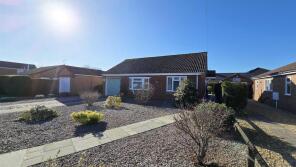
| Today | See today's value |
| 24 Jul 2026 | £260,000 |
| 27 Jul 2016 | £184,995 |
44, Woad Lane, Long Sutton, Spalding PE12 9EW

| Today | See today's value |
| 24 Jul 2026 | £345,000 |
| 18 Dec 1998 | £67,000 |
No other historical records.
53, Anfield Road, Long Sutton, Spalding PE12 9GZ
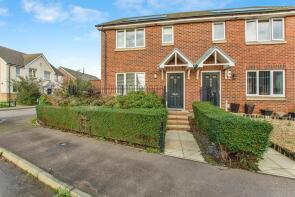
| Today | See today's value |
| 24 Jul 2026 | £96,750 |
| 14 Feb 2020 | £74,250 |
No other historical records.
14, Withington Street, Sutton Bridge, Spalding PE12 9SU
| Today | See today's value |
| 17 Jul 2026 | £200,000 |
| 21 Dec 2021 | £185,000 |
16, Harriet Close, Sutton Bridge, Spalding PE12 9QU

| Today | See today's value |
| 15 Jul 2026 | £300,000 |
| 15 Aug 2003 | £159,000 |
171, Bridge Road, Sutton Bridge, Spalding PE12 9SL

| Today | See today's value |
| 15 Jul 2026 | £340,000 |
| 14 Sep 2006 | £175,000 |
No other historical records.
4, Royal Close, Sutton Bridge, Spalding PE12 9SZ

| Today | See today's value |
| 14 Jul 2026 | £93,000 |
| 28 Mar 2012 | £95,000 |
No other historical records.
3, King Street, Sutton Bridge, Spalding PE12 9RB
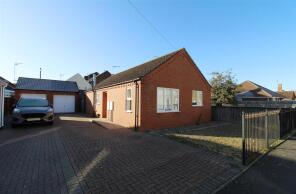
| Today | See today's value |
| 13 Jul 2026 | £170,000 |
| 6 Nov 2017 | £145,000 |
No other historical records.

Rightmove takes no liability for your use of, or reliance on, Rightmove's Instant Valuation due to the limitations of our tracking tool listed here. Use of this tool is taken entirely at your own risk. All rights reserved.