
House Prices in Charfield
House prices in Charfield have an overall average of £385,630 over the last year.
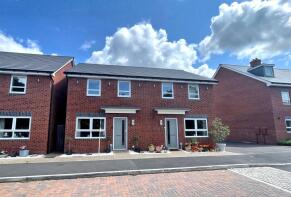
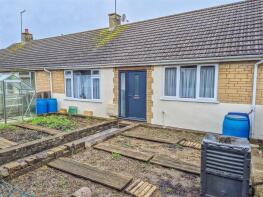
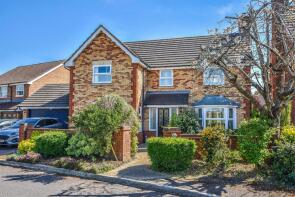
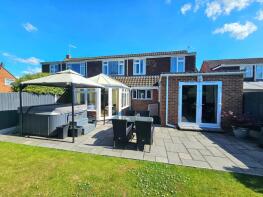
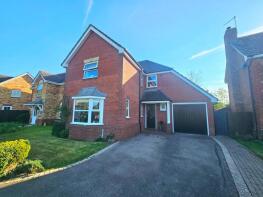
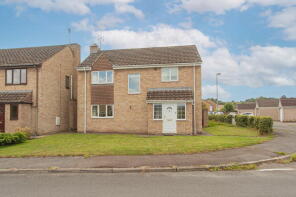
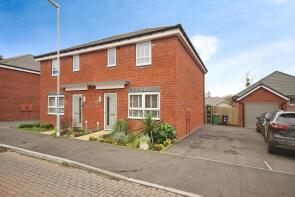
The majority of properties sold in Charfield during the last year were detached properties, selling for an average price of £464,375. Semi-detached properties sold for an average of £358,042, with terraced properties fetching £233,500.
Overall, the historical sold prices in Charfield over the last year were 2% up on the previous year and 3% down on the 2023 peak of £396,371.
Properties Sold
11, Cranesbill Crescent, Wotton-under-edge GL12 8EH

| Today | See what it's worth now |
| 23 Mar 2026 | £490,000 |
| 3 Oct 2017 | £425,000 |
No other historical records.
93, Woodlands Road, Wotton-under-edge GL12 8LT
| Today | See what it's worth now |
| 20 Mar 2026 | £340,000 |
| 29 Apr 2002 | £127,000 |
11, Thames Close, Wotton-under-edge GL12 8UA
| Today | See what it's worth now |
| 13 Mar 2026 | £310,000 |
| 31 Mar 2017 | £222,500 |
No other historical records.
18, Durham Road, Wotton-under-edge GL12 8TH

| Today | See what it's worth now |
| 12 Mar 2026 | £336,000 |
| 23 Aug 1996 | £66,000 |
No other historical records.
27, Poskett Way, Wotton-under-edge GL12 8FF
| Today | See what it's worth now |
| 9 Mar 2026 | £395,000 |
| 17 Dec 2021 | £339,995 |
No other historical records.
98, Poskett Way, Charfield GL12 8FG
| Today | See what it's worth now |
| 5 Dec 2025 | £76,000 |
No other historical records.
16, Poskett Way, Wotton-under-edge GL12 8FG
| Today | See what it's worth now |
| 28 Nov 2025 | £330,000 |
| 13 May 2022 | £331,995 |
No other historical records.
5, May Grove, Wotton-under-edge GL12 8SX
| Today | See what it's worth now |
| 27 Nov 2025 | £240,000 |
| 15 Jul 2016 | £175,000 |
39 Malden House, Longs View, Wotton-under-edge GL12 8HZ
| Today | See what it's worth now |
| 19 Nov 2025 | £625,000 |
| 12 Jan 2006 | £295,000 |
21, Durham Road, Wotton-under-edge GL12 8TH
| Today | See what it's worth now |
| 7 Nov 2025 | £415,000 |
| 21 Oct 2011 | £230,000 |
3, Cranesbill Crescent, Wotton-under-edge GL12 8EH
| Today | See what it's worth now |
| 6 Nov 2025 | £420,000 |
| 22 Aug 2018 | £365,000 |
21, Cowslip Way, Wotton-under-edge GL12 8EF

| Today | See what it's worth now |
| 21 Oct 2025 | £450,000 |
| 25 Jan 2019 | £382,000 |
No other historical records.
18, Berkeley Close, Wotton-under-edge GL12 8TE
| Today | See what it's worth now |
| 20 Oct 2025 | £308,000 |
| 15 Jul 2005 | £172,000 |
No other historical records.
30, Farm Lees, Wotton-under-edge GL12 8JA

| Today | See what it's worth now |
| 17 Oct 2025 | £375,000 |
| 24 Apr 2017 | £249,950 |
No other historical records.
33, Cowslip Way, Wotton-under-edge GL12 8EF
| Today | See what it's worth now |
| 17 Oct 2025 | £632,500 |
| 17 Aug 2018 | £515,000 |
No other historical records.
124, Woodlands Road, Wotton-under-edge GL12 8LU
| Today | See what it's worth now |
| 3 Oct 2025 | £320,000 |
| 16 Apr 1998 | £66,500 |
No other historical records.
5, Charfield Green, Wotton-under-edge GL12 8SZ
| Today | See what it's worth now |
| 26 Sep 2025 | £227,000 |
| 11 Jun 1999 | £59,950 |
No other historical records.
43, Longs View, Wotton-under-edge GL12 8HZ
| Today | See what it's worth now |
| 25 Sep 2025 | £525,000 |
| 1 Jul 1999 | £143,000 |
6, Avon Road, Wotton-under-edge GL12 8TT
| Today | See what it's worth now |
| 22 Sep 2025 | £327,500 |
| 4 Aug 2017 | £225,000 |
59, Woodlands Road, Wotton-under-edge GL12 8LT
| Today | See what it's worth now |
| 16 Sep 2025 | £460,000 |
| 18 Aug 1995 | £78,500 |
No other historical records.
52, Longs View, Wotton-under-edge GL12 8HZ
| Today | See what it's worth now |
| 5 Sep 2025 | £455,000 |
| 17 Nov 2000 | £159,000 |
46, Longs View, Wotton-under-edge GL12 8HZ
| Today | See what it's worth now |
| 29 Aug 2025 | £455,000 |
| 5 Dec 2011 | £250,000 |
No other historical records.
38 Boronia, Underhill Road, Wotton-under-edge GL12 8TQ
| Today | See what it's worth now |
| 7 Aug 2025 | £400,000 |
| 25 Mar 2015 | £278,150 |
No other historical records.
Source Acknowledgement: © Crown copyright. England and Wales house price data is publicly available information produced by the HM Land Registry.This material was last updated on 9 July 2026. It covers the period from 1 January 1995 to 30 April 2026 and contains property transactions which have been registered during that period. Contains HM Land Registry data © Crown copyright and database right 2026. This data is licensed under the Open Government Licence v3.0.
Disclaimer: Rightmove.co.uk provides this HM Land Registry data "as is". The burden for fitness of the data relies completely with the user and is provided for informational purposes only. No warranty, express or implied, is given relating to the accuracy of content of the HM Land Registry data and Rightmove does not accept any liability for error or omission. If you have found an error with the data or need further information please contact HM Land Registry.
Permitted Use: Viewers of this Information are granted permission to access this Crown copyright material and to download it onto electronic, magnetic, optical or similar storage media provided that such activities are for private research, study or in-house use only. Any other use of the material requires the formal written permission of Land Registry which can be requested from us, and is subject to an additional licence and associated charge.
Rightmove takes no liability for your use of, or reliance on, Rightmove's Instant Valuation due to the limitations of our tracking tool listed here. Use of this tool is taken entirely at your own risk. All rights reserved.