
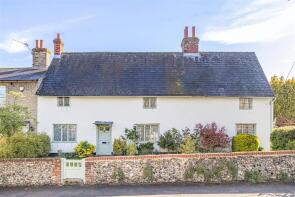
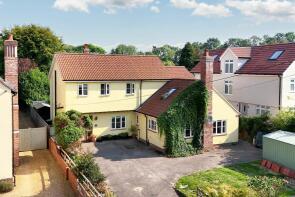
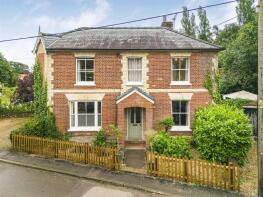
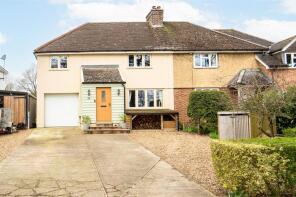
House Prices in Cheveley
House prices in Cheveley have an overall average of £582,000 over the last year.
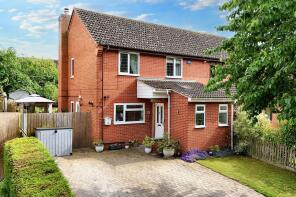
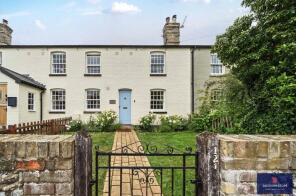
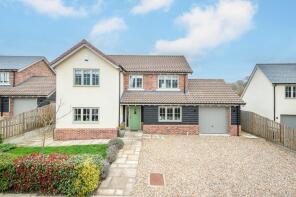
The majority of properties sold in Cheveley during the last year were detached properties, selling for an average price of £841,917. Terraced properties sold for an average of £345,700, with semi-detached properties fetching £393,000.
Overall, the historical sold prices in Cheveley over the last year were 24% up on the previous year and 19% down on the 2023 peak of £719,000.
Properties Sold
57 Fairlawns, High Street, Newmarket CB8 9DQ
| Today | See what it's worth now |
| 1 Apr 2026 | £552,500 |
| 28 Jun 2018 | £550,000 |
No other historical records.
27, Park Road, Newmarket CB8 9DF
| Today | See what it's worth now |
| 16 Mar 2026 | £400,000 |
| 8 May 2018 | £275,000 |
161 163 South Cottage, High Street, Newmarket CB8 9DG
| Today | See what it's worth now |
| 5 Dec 2025 | £549,000 |
| 8 Jan 2004 | £367,500 |
24, Holland Park, Cheveley CB8 9DL
| Today | See what it's worth now |
| 28 Nov 2025 | £215,000 |
No other historical records.
17, Park Road, Newmarket CB8 9DF
| Today | See what it's worth now |
| 25 Nov 2025 | £386,000 |
| 19 Dec 2014 | £202,000 |
121, High Street, Newmarket CB8 9DG
| Today | See what it's worth now |
| 30 Sep 2025 | £369,000 |
| 24 Apr 2020 | £315,000 |
1, The Paddocks, Newmarket CB8 9EU
| Today | See what it's worth now |
| 26 Sep 2025 | £875,000 |
| 6 Sep 2017 | £725,000 |
No other historical records.
8 Newton House, Brook Field, Newmarket CB8 9FX
| Today | See what it's worth now |
| 12 Sep 2025 | £1,360,000 |
| 28 Mar 2023 | £1,188,000 |
No other historical records.
137 Oak Cottage, High Street, Newmarket CB8 9DG
| Today | See what it's worth now |
| 22 Aug 2025 | £525,000 |
| 29 Sep 2021 | £415,000 |
No other historical records.
7, Hobbs Warren, Newmarket CB8 9FG
| Today | See what it's worth now |
| 20 Aug 2025 | £665,000 |
| 27 Jan 2020 | £500,000 |
No other historical records.
7 Lestyle Lodge, Cheveley Park, Newmarket CB8 9DE
| Today | See what it's worth now |
| 18 Aug 2025 | £372,000 |
| 20 Sep 1996 | £75,000 |
No other historical records.
6, Brook Field, Newmarket CB8 9FX
| Today | See what it's worth now |
| 18 Jul 2025 | £1,050,000 |
| 29 Jun 2021 | £400,000 |
No other historical records.
30, Holland Park, Newmarket CB8 9DL

| Today | See what it's worth now |
| 15 Jul 2025 | £247,500 |
| 15 May 2015 | £207,500 |
4, Flowers Green, Cheveley CB8 9FZ
| Today | See what it's worth now |
| 20 Jun 2025 | £475,000 |
No other historical records.
22, Icknield Close, Newmarket CB8 9SU
| Today | See what it's worth now |
| 13 Jun 2025 | £275,000 |
| 1 Dec 1999 | £87,500 |
130, High Street, Newmarket CB8 9DG
| Today | See what it's worth now |
| 12 Jun 2025 | £1,130,000 |
| 17 Dec 2020 | £810,000 |
51, High Street, Cheveley CB8 9DQ
| Today | See what it's worth now |
| 27 May 2025 | £266,000 |
No other historical records.
10, Cheveley Park, Newmarket CB8 9DE
| Today | See what it's worth now |
| 30 Apr 2025 | £210,000 |
| 1 Mar 2019 | £175,000 |
8, Moulton Road, Cheveley CB8 9DN
| Today | See what it's worth now |
| 31 Mar 2025 | £485,000 |
No other historical records.
5, Newmarket Road, Cheveley CB8 9EQ
| Today | See what it's worth now |
| 28 Mar 2025 | £510,000 |
No other historical records.
1, Holland Park, Newmarket CB8 9DL
| Today | See what it's worth now |
| 28 Mar 2025 | £275,000 |
| 5 Aug 2022 | £219,000 |
15, High Street, Newmarket CB8 9DQ
| Today | See what it's worth now |
| 28 Mar 2025 | £740,000 |
| 25 Feb 2002 | £195,000 |
No other historical records.
5, Holland Park, Newmarket CB8 9DL
| Today | See what it's worth now |
| 28 Mar 2025 | £420,000 |
No other historical records.
Source Acknowledgement: © Crown copyright. England and Wales house price data is publicly available information produced by the HM Land Registry.This material was last updated on 9 July 2026. It covers the period from 1 January 1995 to 30 April 2026 and contains property transactions which have been registered during that period. Contains HM Land Registry data © Crown copyright and database right 2026. This data is licensed under the Open Government Licence v3.0.
Disclaimer: Rightmove.co.uk provides this HM Land Registry data "as is". The burden for fitness of the data relies completely with the user and is provided for informational purposes only. No warranty, express or implied, is given relating to the accuracy of content of the HM Land Registry data and Rightmove does not accept any liability for error or omission. If you have found an error with the data or need further information please contact HM Land Registry.
Permitted Use: Viewers of this Information are granted permission to access this Crown copyright material and to download it onto electronic, magnetic, optical or similar storage media provided that such activities are for private research, study or in-house use only. Any other use of the material requires the formal written permission of Land Registry which can be requested from us, and is subject to an additional licence and associated charge.
Rightmove takes no liability for your use of, or reliance on, Rightmove's Instant Valuation due to the limitations of our tracking tool listed here. Use of this tool is taken entirely at your own risk. All rights reserved.