
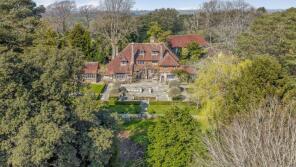
House Prices in Chiddingly
House prices in Chiddingly have an overall average of £835,800 over the last year.
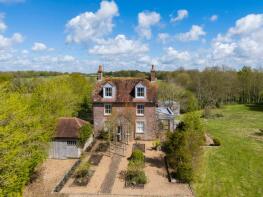
The majority of properties sold in Chiddingly during the last year were detached properties, selling for an average price of £870,000. Semi-detached properties sold for an average of £699,000.
Overall, the historical sold prices in Chiddingly over the last year were 24% up on the previous year and 37% down on the 2021 peak of £1,327,500.
Properties Sold
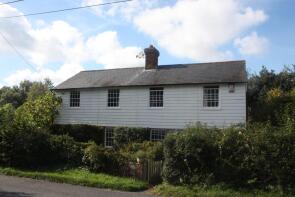
School House, Muddles Green, Lewes BN8 6HN
| Today | See what it's worth now |
| 2 Feb 2026 | £875,000 |
| 18 Aug 2017 | £740,000 |
Friths Farm, Highlands Lane, Chiddingly BN8 6HD

| Today | See what it's worth now |
| 26 Nov 2025 | £1,310,000 |
No other historical records.
Swallow Cottage, The Street, Lewes BN8 6HT
| Today | See what it's worth now |
| 8 Oct 2025 | £665,000 |
| 17 Jan 2000 | £230,000 |
No other historical records.
2, Gatehouse Cottage, Gun Hill, Heathfield TN21 0JU
| Today | See what it's worth now |
| 4 Aug 2025 | £699,000 |
| 28 Jun 2019 | £555,000 |
Birch Cottage, Muddles Green, Lewes BN8 6HN
| Today | See what it's worth now |
| 1 Jul 2025 | £630,000 |
| 5 Sep 1997 | £130,000 |
No other historical records.
Holly Cottage, Nash Street, Golden Cross, Chiddingly BN27 4AB
| Today | See what it's worth now |
| 25 Apr 2025 | £280,000 |
No other historical records.
Brook Cottages, Nash Street, Chiddingly BN27 4AB
| Today | See what it's worth now |
| 17 Jan 2025 | £707,500 |
| 22 Jun 2001 | £265,000 |
No other historical records.
Oaklands, Muddles Green, Lewes BN8 6HR

| Today | See what it's worth now |
| 29 Oct 2024 | £840,000 |
| 8 Aug 2012 | £655,000 |
Orchard Cottage, The Street, Chiddingly BN8 6HT
| Today | See what it's worth now |
| 29 Oct 2024 | £685,000 |
| 13 Aug 2013 | £375,000 |
No other historical records.
Whitesmith Paddocks, Whitesmith, Lewes BN8 6JD
| Today | See what it's worth now |
| 4 Sep 2024 | £1,210,000 |
| 19 Oct 2001 | £440,000 |
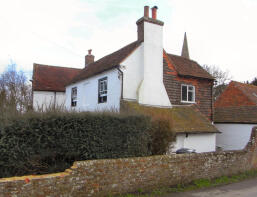
Old Drapers Cottage, Church Lane, Lewes BN8 6HE
| Today | See what it's worth now |
| 12 Aug 2024 | £600,000 |
| 22 May 2006 | £222,000 |
No other historical records.
Jenleigh, Muddles Green, Lewes BN8 6HP
| Today | See what it's worth now |
| 18 Jul 2024 | £410,000 |
No other historical records.
Hale Farm Cottage, Hale Green, Lewes BN8 6HQ

| Today | See what it's worth now |
| 9 Apr 2024 | £557,000 |
No other historical records.
2, Willetts Cottages, Muddles Green, Lewes BN8 6HR

| Today | See what it's worth now |
| 26 Mar 2024 | £812,100 |
| 26 May 2005 | £410,000 |
The Pekes Lodge, Thunders Hill, Golden Cross, Chiddingly BN27 4AE
| Today | See what it's worth now |
| 26 Mar 2024 | £865,000 |
| 18 Feb 2016 | £582,500 |
The Manor House, Chiddingly Place, Highlands Lane, Lewes BN8 6HE
| Today | See what it's worth now |
| 30 Jun 2023 | £1,920,000 |
| 29 Jan 2008 | £1,500,000 |
No other historical records.
Willetts Bungalow, Muddles Green, Lewes BN8 6HR

| Today | See what it's worth now |
| 9 Jun 2023 | £885,000 |
| 29 Jun 2021 | £905,000 |
Whitesmith Barn, Whitesmith Lane, Lewes BN8 6HA
| Today | See what it's worth now |
| 27 Mar 2023 | £975,000 |
| 9 Aug 1996 | £95,000 |
No other historical records.
Chiddinghurst, Scrapers Hill, Lewes BN8 6HJ
| Today | See what it's worth now |
| 31 Aug 2022 | £2,250,000 |
| 21 Oct 2016 | £1,300,000 |
No other historical records.
Stonehill House, Stonehill, Heathfield TN21 0JN
| Today | See what it's worth now |
| 15 Jul 2022 | £2,484,000 |
No other historical records.
Robinson House, Church Lane, Lewes BN8 6HE

| Today | See what it's worth now |
| 28 Jun 2022 | £400,000 |
No other historical records.
Rose Cottage, The Street, Lewes BN8 6HT
| Today | See what it's worth now |
| 28 Jun 2022 | £510,000 |
No other historical records.
Friths Farmhouse, Highlands Lane, Lewes BN8 6HD
| Today | See what it's worth now |
| 12 Apr 2022 | £1,475,000 |
| 30 Nov 2012 | £925,000 |
No other historical records.

Source Acknowledgement: © Crown copyright. England and Wales house price data is publicly available information produced by the HM Land Registry.This material was last updated on 9 July 2026. It covers the period from 1 January 1995 to 30 April 2026 and contains property transactions which have been registered during that period. Contains HM Land Registry data © Crown copyright and database right 2026. This data is licensed under the Open Government Licence v3.0.
Disclaimer: Rightmove.co.uk provides this HM Land Registry data "as is". The burden for fitness of the data relies completely with the user and is provided for informational purposes only. No warranty, express or implied, is given relating to the accuracy of content of the HM Land Registry data and Rightmove does not accept any liability for error or omission. If you have found an error with the data or need further information please contact HM Land Registry.
Permitted Use: Viewers of this Information are granted permission to access this Crown copyright material and to download it onto electronic, magnetic, optical or similar storage media provided that such activities are for private research, study or in-house use only. Any other use of the material requires the formal written permission of Land Registry which can be requested from us, and is subject to an additional licence and associated charge.
Rightmove takes no liability for your use of, or reliance on, Rightmove's Instant Valuation due to the limitations of our tracking tool listed here. Use of this tool is taken entirely at your own risk. All rights reserved.