
House Prices in Childswickham
House prices in Childswickham have an overall average of £492,857 over the last year.
The majority of properties sold in Childswickham during the last year were detached properties, selling for an average price of £546,250. Semi-detached properties sold for an average of £448,750, with terraced properties fetching £367,500.
Overall, the historical sold prices in Childswickham over the last year were 3% down on the previous year and 39% down on the 2023 peak of £811,000.
Properties Sold
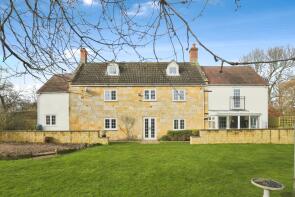
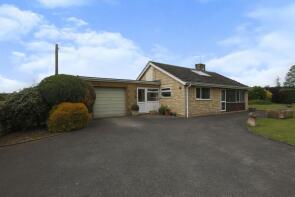
Wynstones, Broadway Road, Broadway WR12 7HP
| Today | See what it's worth now |
| 28 Nov 2025 | £390,000 |
| 1 Nov 1996 | £100,000 |
No other historical records.
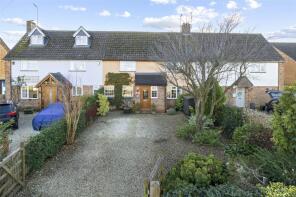
5, Broadway Road, Broadway WR12 7HP
| Today | See what it's worth now |
| 12 Nov 2025 | £500,000 |
| 22 Jan 2010 | £250,000 |
Woodville, Broadway Road, Broadway WR12 7HD
| Today | See what it's worth now |
| 31 Oct 2025 | £425,000 |
| 13 Jan 2003 | £195,000 |
Delaway, Broadway Road, Childswickham WR12 7HD
| Today | See what it's worth now |
| 22 Oct 2025 | £500,000 |
No other historical records.
12, Hinton Road, Broadway WR12 7HY

| Today | See what it's worth now |
| 28 Aug 2025 | £397,500 |
| 2 Oct 2020 | £350,000 |
15, Broadway Road, Broadway WR12 7HP
| Today | See what it's worth now |
| 18 Aug 2025 | £367,500 |
| 14 Jul 2010 | £163,000 |
No other historical records.
The Harbinger, Buckland Road, Broadway WR12 7HH
| Today | See what it's worth now |
| 30 Jul 2025 | £870,000 |
| 3 Aug 1998 | £260,000 |
No other historical records.
The Brakes, Broadway Road, Broadway WR12 7HP

| Today | See what it's worth now |
| 16 Jun 2025 | £840,000 |
| 2 Jun 2014 | £530,000 |
No other historical records.
9, Broadway Road, Broadway WR12 7HP
| Today | See what it's worth now |
| 23 May 2025 | £350,000 |
| 8 Mar 1996 | £57,000 |
No other historical records.
Rosecoombe, New Street, Childswickham WR12 7HQ
| Today | See what it's worth now |
| 28 Mar 2025 | £595,000 |
No other historical records.
4, Hinton Road, Childswickham WR12 7HY

| Today | See what it's worth now |
| 17 Feb 2025 | £325,000 |
No other historical records.
21 Campden House, Green Close, Broadway WR12 7JJ
| Today | See what it's worth now |
| 31 Jan 2025 | £435,000 |
| 4 Mar 2016 | £285,000 |
5, Hinton Road, Childswickham WR12 7HY

| Today | See what it's worth now |
| 24 Jan 2025 | £345,000 |
No other historical records.
The Cottage, Atkinson Street, Broadway WR12 7HF
| Today | See what it's worth now |
| 11 Dec 2024 | £425,000 |
| 18 May 2018 | £325,000 |
1, Glebe Cottages, Broadway Road, Broadway WR12 7HD
| Today | See what it's worth now |
| 4 Nov 2024 | £420,000 |
| 18 May 2018 | £345,000 |
Spring Cottage, Atkinson Street, Broadway WR12 7HF

| Today | See what it's worth now |
| 4 Nov 2024 | £725,000 |
| 11 May 2001 | £237,000 |
No other historical records.
Bungalow Farm, Murcot Road, Broadway WR12 7HR

| Today | See what it's worth now |
| 25 Sep 2024 | £640,000 |
| 23 Feb 2018 | £432,500 |
Brook House, The Cross, Broadway WR12 7HJ
| Today | See what it's worth now |
| 16 Aug 2024 | £795,000 |
| 18 Sep 2009 | £495,000 |
Strathaird, Twitchams Lane, Childswickham WR12 7HG

| Today | See what it's worth now |
| 21 Jun 2024 | £425,000 |
No other historical records.
4, Broadway Road, Broadway WR12 7HP
| Today | See what it's worth now |
| 14 Jun 2024 | £370,000 |
No other historical records.
15, Green Close, Childswickham WR12 7JJ
| Today | See what it's worth now |
| 14 Jun 2024 | £400,000 |
No other historical records.
The Old Mill, The Cross, Broadway WR12 7HJ

| Today | See what it's worth now |
| 13 Oct 2023 | £1,320,000 |
No other historical records.
17, Broadway Road, Childswickham WR12 7HP

| Today | See what it's worth now |
| 9 Jun 2023 | £285,000 |
No other historical records.
Source Acknowledgement: © Crown copyright. England and Wales house price data is publicly available information produced by the HM Land Registry.This material was last updated on 9 July 2026. It covers the period from 1 January 1995 to 30 April 2026 and contains property transactions which have been registered during that period. Contains HM Land Registry data © Crown copyright and database right 2026. This data is licensed under the Open Government Licence v3.0.
Disclaimer: Rightmove.co.uk provides this HM Land Registry data "as is". The burden for fitness of the data relies completely with the user and is provided for informational purposes only. No warranty, express or implied, is given relating to the accuracy of content of the HM Land Registry data and Rightmove does not accept any liability for error or omission. If you have found an error with the data or need further information please contact HM Land Registry.
Permitted Use: Viewers of this Information are granted permission to access this Crown copyright material and to download it onto electronic, magnetic, optical or similar storage media provided that such activities are for private research, study or in-house use only. Any other use of the material requires the formal written permission of Land Registry which can be requested from us, and is subject to an additional licence and associated charge.
Rightmove takes no liability for your use of, or reliance on, Rightmove's Instant Valuation due to the limitations of our tracking tool listed here. Use of this tool is taken entirely at your own risk. All rights reserved.