
House Prices in Chilham
House prices in Chilham have an overall average of £633,083 over the last year.
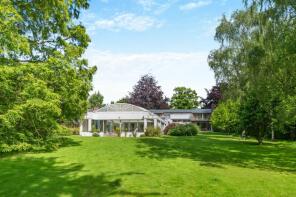
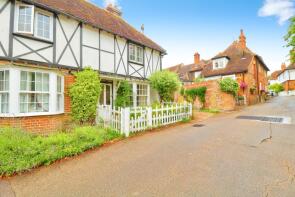
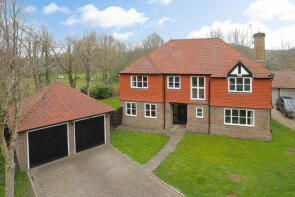
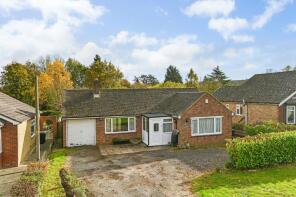
The majority of properties sold in Chilham during the last year were detached properties, selling for an average price of £793,375. Terraced properties sold for an average of £312,500.
Overall, the historical sold prices in Chilham over the last year were 9% up on the previous year and 2% down on the 2022 peak of £643,000.
Properties Sold
Merton House, Hambrook Lane, Chilham CT4 8DJ
| Today | See what it's worth now |
| 11 Feb 2026 | £1,400,000 |
No other historical records.
3, Alexandra Villas, The Street, Chilham CT4 8BX
| Today | See what it's worth now |
| 22 Dec 2025 | £280,000 |
No other historical records.
4, Arden Grange, Canterbury CT4 8DR
| Today | See what it's worth now |
| 27 Nov 2025 | £725,000 |
| 1 Jun 2004 | £520,000 |
17, Bagham Place, Canterbury CT4 8DF

| Today | See what it's worth now |
| 12 Sep 2025 | £345,000 |
| 16 Dec 2016 | £299,995 |
No other historical records.
The Snuggery, Canterbury Road, Canterbury CT4 8AE
| Today | See what it's worth now |
| 6 Aug 2025 | £355,000 |
| 23 Feb 2007 | £225,000 |
No other historical records.
Homefield House, Canterbury Road, Canterbury CT4 8DX
| Today | See what it's worth now |
| 4 Jul 2025 | £693,500 |
| 17 Dec 2020 | £605,000 |
No other historical records.
Mayo, Pilgrims Lane, Chilham CT4 8AB
| Today | See what it's worth now |
| 20 Jun 2025 | £620,000 |
No other historical records.
4, Bagham Cross Cottages, Bagham Lane, Canterbury CT4 8DU
| Today | See what it's worth now |
| 6 Jun 2025 | £336,000 |
| 7 Jun 2019 | £280,000 |
St Magnus, Shalmsford Road, Chilham CT4 8AD

| Today | See what it's worth now |
| 19 May 2025 | £555,000 |
No other historical records.
Cumberland Bungalow, The Street, Chilham CT4 8BX
| Today | See what it's worth now |
| 31 Mar 2025 | £460,000 |
No other historical records.
5, Meadow Close, Chilham CT4 8DY
| Today | See what it's worth now |
| 27 Mar 2025 | £395,000 |
No other historical records.
Cumberland House, The Street, Chilham CT4 8BX
| Today | See what it's worth now |
| 14 Feb 2025 | £1,475,000 |
No other historical records.
Thydon Cottage, The Street, Canterbury CT4 8BX
| Today | See what it's worth now |
| 14 Feb 2025 | £695,750 |
| 19 Jan 2012 | £465,000 |
2, Old Sawmills Row, Mill Lane, Canterbury CT4 8BU
| Today | See what it's worth now |
| 6 Dec 2024 | £332,000 |
| 22 Oct 2020 | £308,500 |
5, Bagham Cross Cottages, Bagham Lane, Canterbury CT4 8DU

| Today | See what it's worth now |
| 28 Oct 2024 | £407,500 |
| 2 Feb 2021 | £348,000 |
Isomer, Pilgrims Lane, Chilham CT4 8AA
| Today | See what it's worth now |
| 8 Oct 2024 | £460,000 |
No other historical records.
26, Bagham Place, Canterbury CT4 8DF
| Today | See what it's worth now |
| 27 Aug 2024 | £325,000 |
| 20 Jan 2017 | £307,995 |
No other historical records.
Berry House, Mulberry Hill, Canterbury CT4 8AH

| Today | See what it's worth now |
| 31 Jul 2024 | £1,425,000 |
| 8 Jun 1998 | £475,000 |
No other historical records.
6, Felborough Close, Chilham CT4 8DS
| Today | See what it's worth now |
| 26 Jul 2024 | £300,000 |
No other historical records.
Rusbur, Shalmsford Road, Canterbury CT4 8AD

| Today | See what it's worth now |
| 4 Jul 2024 | £450,000 |
| 7 Aug 2019 | £350,000 |
3, Church Hill, Canterbury CT4 8DA

| Today | See what it's worth now |
| 11 Jun 2024 | £510,000 |
| 16 Jan 2006 | £319,000 |
2, Hendon Cottages, Canterbury Road, Canterbury CT4 8DX

| Today | See what it's worth now |
| 21 Nov 2023 | £225,000 |
| 24 Apr 2015 | £155,000 |
The Cottage, Hazelmere, Canterbury Road, Canterbury CT4 8DX

| Today | See what it's worth now |
| 7 Nov 2023 | £390,000 |
| 10 Feb 2022 | £395,000 |
Source Acknowledgement: © Crown copyright. England and Wales house price data is publicly available information produced by the HM Land Registry.This material was last updated on 9 July 2026. It covers the period from 1 January 1995 to 30 April 2026 and contains property transactions which have been registered during that period. Contains HM Land Registry data © Crown copyright and database right 2026. This data is licensed under the Open Government Licence v3.0.
Disclaimer: Rightmove.co.uk provides this HM Land Registry data "as is". The burden for fitness of the data relies completely with the user and is provided for informational purposes only. No warranty, express or implied, is given relating to the accuracy of content of the HM Land Registry data and Rightmove does not accept any liability for error or omission. If you have found an error with the data or need further information please contact HM Land Registry.
Permitted Use: Viewers of this Information are granted permission to access this Crown copyright material and to download it onto electronic, magnetic, optical or similar storage media provided that such activities are for private research, study or in-house use only. Any other use of the material requires the formal written permission of Land Registry which can be requested from us, and is subject to an additional licence and associated charge.
Rightmove takes no liability for your use of, or reliance on, Rightmove's Instant Valuation due to the limitations of our tracking tool listed here. Use of this tool is taken entirely at your own risk. All rights reserved.