
House Prices in Chirk
House prices in Chirk have an overall average of £260,156 over the last year.
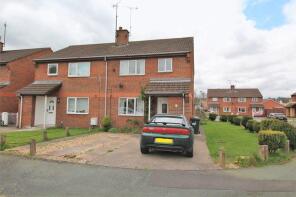
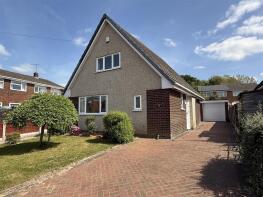
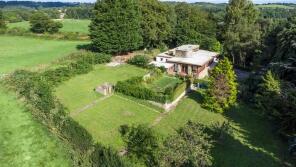
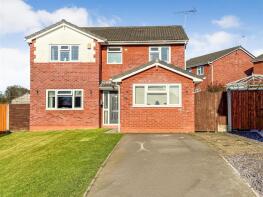
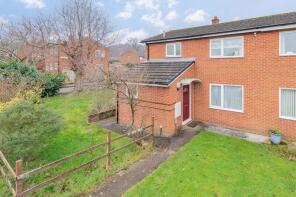
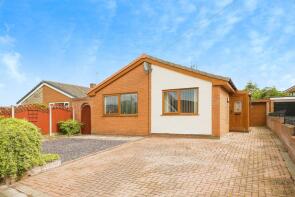
The majority of properties sold in Chirk during the last year were detached properties, selling for an average price of £322,333. Semi-detached properties sold for an average of £215,750, with terraced properties fetching £156,500.
Overall, the historical sold prices in Chirk over the last year were 24% up on the previous year and 21% up on the 2022 peak of £214,455.
Properties Sold
11, Yr Helfa, Lodgevale Park, Wrexham LL14 5EP
| Today | See what it's worth now |
| 17 Apr 2026 | £178,000 |
| 5 Jun 2014 | £101,000 |
9, Whitehurst Gardens, Chirk, Wrexham LL14 5AT
| Today | See what it's worth now |
| 27 Mar 2026 | £152,500 |
| 21 Aug 2020 | £122,500 |
4, Maes Hyfryd, Lodgevale Park, Wrexham LL14 5AQ
| Today | See what it's worth now |
| 16 Mar 2026 | £290,000 |
| 2 Sep 2005 | £165,000 |
No other historical records.
85, Longfield, Chirk, Wrexham LL14 5RE
| Today | See what it's worth now |
| 25 Feb 2026 | £160,000 |
| 3 May 2002 | £45,500 |
No other historical records.
127, Bron Y Waun, Chirk, Wrexham LL14 5PW
| Today | See what it's worth now |
| 19 Feb 2026 | £147,000 |
| 27 Jun 2008 | £105,265 |
No other historical records.
1, Ewart Street, Chirk, Wrexham LL14 5LA
| Today | See what it's worth now |
| 30 Jan 2026 | £195,000 |
| 18 Nov 2015 | £95,000 |
41, Church View, Chirk, Wrexham LL14 5PE
| Today | See what it's worth now |
| 23 Jan 2026 | £140,000 |
| 4 May 2012 | £86,000 |
No other historical records.
73, Offa, Lodgevale Park, Wrexham LL14 5DJ

| Today | See what it's worth now |
| 23 Jan 2026 | £220,000 |
| 15 Mar 2018 | £149,000 |
73, Crogen, Lodgevale Park, Wrexham LL14 5BJ
| Today | See what it's worth now |
| 6 Jan 2026 | £210,000 |
| 20 Jul 2007 | £141,000 |
The Cottage, The Lodge, Road From Council Depot To Holyhead Road, Black Park, Wrexham LL14 5AU
| Today | See what it's worth now |
| 10 Dec 2025 | £590,000 |
| 25 Aug 2017 | £70,000 |
No other historical records.
69, Offa, Lodgevale Park, Wrexham LL14 5BP
| Today | See what it's worth now |
| 3 Dec 2025 | £195,000 |
| 12 Apr 2006 | £137,500 |
16, Telford Rise, Chirk, Wrexham LL14 5AJ
| Today | See what it's worth now |
| 27 Nov 2025 | £340,000 |
| 27 Oct 2021 | £275,000 |
3, The Nurseries, Chirk, Wrexham LL14 5NQ

| Today | See what it's worth now |
| 21 Nov 2025 | £375,000 |
| 17 Dec 1999 | £81,000 |
No other historical records.
Cloud Hill, A5 From Cross Street To New Hall Farm Road, Pentre, Wrexham LL14 5AN
| Today | See what it's worth now |
| 31 Oct 2025 | £540,000 |
| 2 Aug 1996 | £130,000 |
No other historical records.
7, Maes Y Berwyn, Lodgevale Park, Wrexham LL14 5RA
| Today | See what it's worth now |
| 22 Oct 2025 | £350,000 |
| 10 Nov 2006 | £205,000 |
19, Craig Close, Chirk, Wrexham LL14 5NY
| Today | See what it's worth now |
| 17 Oct 2025 | £208,000 |
No other historical records.
63, Crogen, Lodgevale Park, Wrexham LL14 5BN
| Today | See what it's worth now |
| 14 Oct 2025 | £230,000 |
| 8 Oct 2015 | £142,000 |
The Gables, Fron Isaf, Chirk LL14 5AH
| Today | See what it's worth now |
| 14 Oct 2025 | £169,500 |
| 26 Mar 2020 | £145,000 |
No other historical records.
6, Offa, Lodgevale Park, Wrexham LL14 5BP
| Today | See what it's worth now |
| 7 Oct 2025 | £250,000 |
| 10 Jan 2006 | £126,000 |
No other historical records.
60, Longfield, Chirk, Wrexham LL14 5RE
| Today | See what it's worth now |
| 26 Sep 2025 | £175,000 |
| 26 Mar 2021 | £127,000 |
Holbeach, Maes Y Waun, Chirk, Wrexham LL14 5ND
| Today | See what it's worth now |
| 25 Sep 2025 | £220,000 |
No other historical records.
Chirk Manor, Trevor Road, Chirk, Wrexham LL14 5HD
| Today | See what it's worth now |
| 11 Sep 2025 | £710,000 |
| 28 Mar 2007 | £795,000 |
No other historical records.
Roselea Cottage, Lane From Mountain View To Lloyds Lane, Chirk Green, Wrexham LL14 5PY

| Today | See what it's worth now |
| 1 Sep 2025 | £200,000 |
| 29 Jun 2001 | £63,000 |
Source Acknowledgement: © Crown copyright. England and Wales house price data is publicly available information produced by the HM Land Registry.This material was last updated on 9 July 2026. It covers the period from 1 January 1995 to 30 April 2026 and contains property transactions which have been registered during that period. Contains HM Land Registry data © Crown copyright and database right 2026. This data is licensed under the Open Government Licence v3.0.
Disclaimer: Rightmove.co.uk provides this HM Land Registry data "as is". The burden for fitness of the data relies completely with the user and is provided for informational purposes only. No warranty, express or implied, is given relating to the accuracy of content of the HM Land Registry data and Rightmove does not accept any liability for error or omission. If you have found an error with the data or need further information please contact HM Land Registry.
Permitted Use: Viewers of this Information are granted permission to access this Crown copyright material and to download it onto electronic, magnetic, optical or similar storage media provided that such activities are for private research, study or in-house use only. Any other use of the material requires the formal written permission of Land Registry which can be requested from us, and is subject to an additional licence and associated charge.
Rightmove takes no liability for your use of, or reliance on, Rightmove's Instant Valuation due to the limitations of our tracking tool listed here. Use of this tool is taken entirely at your own risk. All rights reserved.