
House Prices in Clavering
House prices in Clavering have an overall average of £197,488 over the last year.
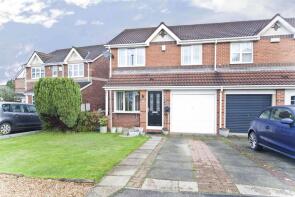
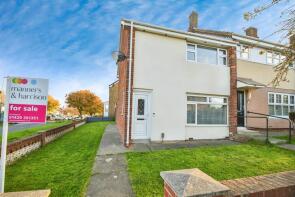
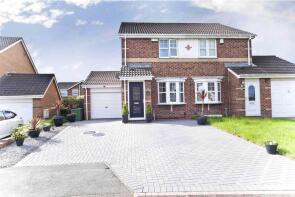
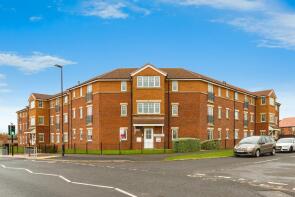
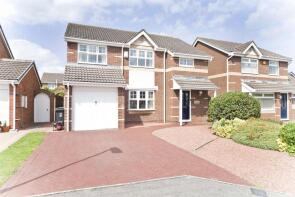
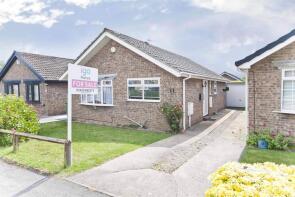
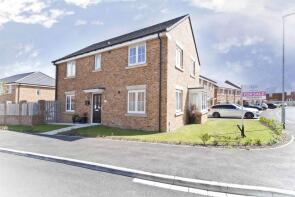
The majority of properties sold in Clavering during the last year were semi-detached properties, selling for an average price of £158,385. Detached properties sold for an average of £283,520, with terraced properties fetching £150,308.
Overall, the historical sold prices in Clavering over the last year were 11% down on the previous year and 8% down on the 2023 peak of £214,704.
Properties Sold
39, Talland Close, Hartlepool TS27 3NB
| Today | See what it's worth now |
| 10 Mar 2026 | £181,000 |
| 2 Dec 2020 | £149,000 |
80, Clavering Road, Hartlepool TS27 3PJ
| Today | See what it's worth now |
| 6 Mar 2026 | £95,000 |
| 28 Sep 2012 | £77,000 |
No other historical records.
52, Ashwood Close, Hartlepool TS27 3QX
| Today | See what it's worth now |
| 6 Mar 2026 | £170,000 |
| 17 Dec 2004 | £110,000 |
No other historical records.
19, Strawberry Apartments, Lady Mantle Close, Hartlepool TS26 0RP
| Today | See what it's worth now |
| 5 Mar 2026 | £95,000 |
| 19 May 2023 | £84,000 |
25, Talland Close, Hartlepool TS27 3NB
| Today | See what it's worth now |
| 4 Mar 2026 | £150,000 |
| 4 Apr 2008 | £125,000 |
22, Wayfarer Meadows, Hartlepool TS27 3FD

| Today | See what it's worth now |
| 2 Mar 2026 | £167,000 |
| 22 Dec 2022 | £185,995 |
No other historical records.
13, Strawberry Apartments, Lady Mantle Close, Hartlepool TS26 0RP
| Today | See what it's worth now |
| 25 Feb 2026 | £78,000 |
| 22 Sep 2024 | £85,000 |
No other historical records.
23, Jaywood Close, Hartlepool TS27 3JG
| Today | See what it's worth now |
| 18 Feb 2026 | £280,000 |
No other historical records.
8, Greywood Close, Hartlepool TS27 3QJ
| Today | See what it's worth now |
| 18 Feb 2026 | £165,000 |
| 14 Jun 2013 | £124,000 |
No other historical records.
41, Aspen Gardens, Hartlepool TS27 3DD
| Today | See what it's worth now |
| 12 Feb 2026 | £282,000 |
| 26 Aug 2022 | £294,995 |
No other historical records.
50, Tavistock Close, Hartlepool TS27 3LB
| Today | See what it's worth now |
| 6 Feb 2026 | £325,000 |
| 9 Jun 1999 | £109,950 |
No other historical records.
22, Spearman Walk, Hartlepool TS27 3PD
| Today | See what it's worth now |
| 6 Feb 2026 | £120,000 |
| 13 Dec 2019 | £105,000 |
8, St Andrews Grove, Hartlepool TS27 3PS
| Today | See what it's worth now |
| 23 Jan 2026 | £218,000 |
| 27 Mar 2020 | £155,000 |
2, Watercress Close, Hartlepool TS26 0QY
| Today | See what it's worth now |
| 23 Jan 2026 | £260,000 |
| 15 May 2009 | £201,500 |
7, Muirfield Walk, Hartlepool TS27 3QE
| Today | See what it's worth now |
| 23 Jan 2026 | £150,000 |
| 30 Jun 2021 | £128,000 |
50, Ashwood Close, Hartlepool TS27 3QX
| Today | See what it's worth now |
| 16 Jan 2026 | £169,000 |
| 11 May 2006 | £128,500 |
51, Torcross Close, Hartlepool TS27 3ND
| Today | See what it's worth now |
| 19 Dec 2025 | £160,000 |
| 11 Feb 2022 | £148,000 |
Ghyll View, The Green, Elwick, Hartlepool TS27 3DS
| Today | See what it's worth now |
| 18 Dec 2025 | £198,000 |
No other historical records.
1-2, White Hart Court, Hart, Hartlepool TS27 3AN
| Today | See what it's worth now |
| 17 Dec 2025 | £154,700 |
No other historical records.
6, Hillcrest Grove, Elwick, Hartlepool TS27 3EH
| Today | See what it's worth now |
| 16 Dec 2025 | £305,000 |
| 2 Aug 2024 | £200,000 |
No other historical records.
12, Thornbury Close, Hartlepool TS27 3RA
| Today | See what it's worth now |
| 15 Dec 2025 | £191,000 |
| 12 Feb 2021 | £151,000 |
26, Tintagel Close, Hartlepool TS27 3NA
| Today | See what it's worth now |
| 5 Dec 2025 | £130,000 |
| 4 Dec 2014 | £103,000 |
3, Muirfield Close, Hartlepool TS27 3QT
| Today | See what it's worth now |
| 5 Dec 2025 | £145,000 |
| 29 Jul 2022 | £120,000 |

Source Acknowledgement: © Crown copyright. England and Wales house price data is publicly available information produced by the HM Land Registry.This material was last updated on 15 May 2026. It covers the period from 1 January 1995 to 31 March 2026 and contains property transactions which have been registered during that period. Contains HM Land Registry data © Crown copyright and database right 2026. This data is licensed under the Open Government Licence v3.0.
Disclaimer: Rightmove.co.uk provides this HM Land Registry data "as is". The burden for fitness of the data relies completely with the user and is provided for informational purposes only. No warranty, express or implied, is given relating to the accuracy of content of the HM Land Registry data and Rightmove does not accept any liability for error or omission. If you have found an error with the data or need further information please contact HM Land Registry.
Permitted Use: Viewers of this Information are granted permission to access this Crown copyright material and to download it onto electronic, magnetic, optical or similar storage media provided that such activities are for private research, study or in-house use only. Any other use of the material requires the formal written permission of Land Registry which can be requested from us, and is subject to an additional licence and associated charge.
Map data ©OpenStreetMap contributors.
Rightmove takes no liability for your use of, or reliance on, Rightmove's Instant Valuation due to the limitations of our tracking tool listed here. Use of this tool is taken entirely at your own risk. All rights reserved.