
House Prices in Clayton
House prices in Clayton have an overall average of £203,913 over the last year.
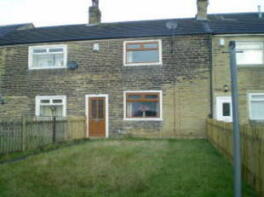
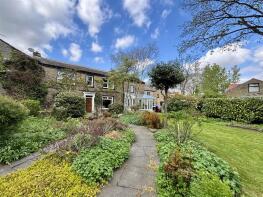
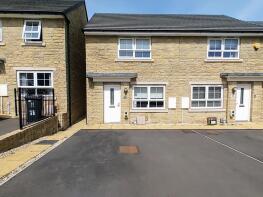
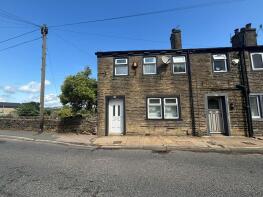
The majority of properties sold in Clayton during the last year were terraced properties, selling for an average price of £143,640. Semi-detached properties sold for an average of £221,403, with detached properties fetching £305,778.
Overall, the historical sold prices in Clayton over the last year were 12% up on the previous year and 3% up on the 2023 peak of £198,107.
Properties Sold
84, Clayton Lane, Clayton, Bradford BD14 6PB
| Today | See what it's worth now |
| 16 Apr 2026 | £140,000 |
No other historical records.
22, Broomcroft, Bradford BD14 6NW

| Today | See what it's worth now |
| 13 Apr 2026 | £149,950 |
| 27 Jul 2020 | £109,950 |
15, May Tree Close, Bradford BD14 6HU
| Today | See what it's worth now |
| 13 Apr 2026 | £39,000 |
| 11 Oct 1996 | £24,500 |
No other historical records.
2, Pipit View, Bradford BD14 6FB
| Today | See what it's worth now |
| 13 Apr 2026 | £260,000 |
| 17 Jul 2020 | £239,995 |
No other historical records.
23, Pipit View, Bradford BD14 6FB
| Today | See what it's worth now |
| 13 Apr 2026 | £380,000 |
| 11 Jun 2021 | £309,995 |
No other historical records.
10, Vignola Terrace, Bradford BD14 6DX

| Today | See what it's worth now |
| 31 Mar 2026 | £80,000 |
| 3 Jul 2006 | £86,000 |
124, Pentland Avenue, Bradford BD14 6JF
| Today | See what it's worth now |
| 27 Mar 2026 | £165,000 |
| 10 Feb 2004 | £54,000 |
No other historical records.
Broadfolds House, Chrisharben Park, Bradford BD14 6AE
| Today | See what it's worth now |
| 25 Mar 2026 | £293,000 |
| 5 Jun 1998 | £105,000 |
No other historical records.
34, Westminster Avenue, Bradford BD14 6SQ
| Today | See what it's worth now |
| 13 Mar 2026 | £195,000 |
| 20 Aug 2021 | £174,995 |
182, Bradford Road, Clayton, Bradford BD14 6DD
| Today | See what it's worth now |
| 9 Mar 2026 | £100,000 |
| 13 Apr 2006 | £86,500 |
5, Fieldway, Bradford BD14 6RP
| Today | See what it's worth now |
| 6 Mar 2026 | £260,000 |
| 4 Jul 2018 | £175,500 |
19, Ashmount, Bradford BD14 6HL
| Today | See what it's worth now |
| 6 Mar 2026 | £137,000 |
| 4 Apr 2023 | £96,000 |
8, Wolseley Street, Bradford BD14 6BY
| Today | See what it's worth now |
| 25 Feb 2026 | £117,000 |
| 6 Jun 2006 | £76,000 |
No other historical records.
3, Fieldway, Bradford BD14 6RP
| Today | See what it's worth now |
| 19 Feb 2026 | £250,000 |
| 2 Mar 2007 | £169,950 |
11, Oakleigh Avenue, Bradford BD14 6QE

| Today | See what it's worth now |
| 10 Feb 2026 | £245,000 |
| 7 May 2021 | £120,000 |
No other historical records.
49, Scholemoor Avenue, Bradford BD7 2RU
| Today | See what it's worth now |
| 9 Feb 2026 | £145,000 |
| 17 Dec 2004 | £78,950 |
No other historical records.
2, Town End Road, Bradford BD14 6BP
| Today | See what it's worth now |
| 6 Feb 2026 | £90,000 |
| 5 Jul 2021 | £82,000 |
112, Pentland Avenue, Clayton, Bradford BD14 6JF
| Today | See what it's worth now |
| 6 Feb 2026 | £173,000 |
No other historical records.
111, Pasture Lane, Bradford BD14 6LR
| Today | See what it's worth now |
| 6 Feb 2026 | £133,000 |
| 6 Nov 2000 | £49,500 |
No other historical records.
15, Beaconsfield Road, Bradford BD14 6LQ

| Today | See what it's worth now |
| 6 Feb 2026 | £123,000 |
| 22 Jun 2021 | £101,000 |
27, Penny Hill Drive, Bradford BD14 6NH
| Today | See what it's worth now |
| 30 Jan 2026 | £187,000 |
| 3 Apr 1998 | £50,000 |
No other historical records.
11, Selborne Villas, Bradford BD14 6JZ
| Today | See what it's worth now |
| 29 Jan 2026 | £195,000 |
| 18 Dec 2007 | £180,000 |
145, Pasture Lane, Bradford BD14 6LR
| Today | See what it's worth now |
| 26 Jan 2026 | £270,000 |
| 1 Jun 2020 | £162,500 |
Source Acknowledgement: © Crown copyright. England and Wales house price data is publicly available information produced by the HM Land Registry.This material was last updated on 9 July 2026. It covers the period from 1 January 1995 to 30 April 2026 and contains property transactions which have been registered during that period. Contains HM Land Registry data © Crown copyright and database right 2026. This data is licensed under the Open Government Licence v3.0.
Disclaimer: Rightmove.co.uk provides this HM Land Registry data "as is". The burden for fitness of the data relies completely with the user and is provided for informational purposes only. No warranty, express or implied, is given relating to the accuracy of content of the HM Land Registry data and Rightmove does not accept any liability for error or omission. If you have found an error with the data or need further information please contact HM Land Registry.
Permitted Use: Viewers of this Information are granted permission to access this Crown copyright material and to download it onto electronic, magnetic, optical or similar storage media provided that such activities are for private research, study or in-house use only. Any other use of the material requires the formal written permission of Land Registry which can be requested from us, and is subject to an additional licence and associated charge.
Rightmove takes no liability for your use of, or reliance on, Rightmove's Instant Valuation due to the limitations of our tracking tool listed here. Use of this tool is taken entirely at your own risk. All rights reserved.