
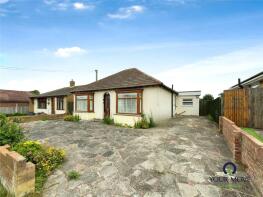
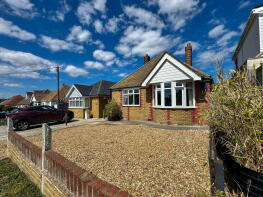
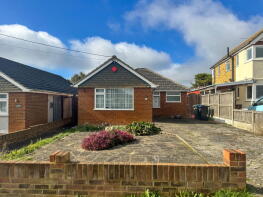
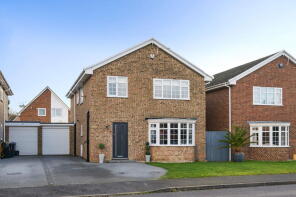
House Prices in Cliffsend
House prices in Cliffsend have an overall average of £386,259 over the last year.
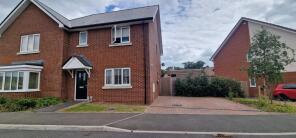
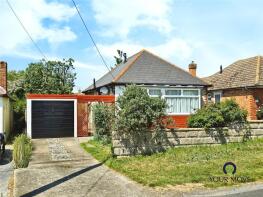
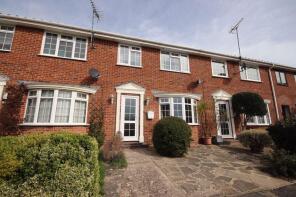
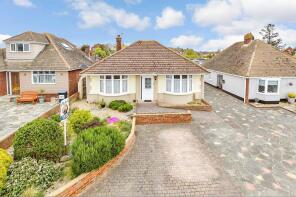
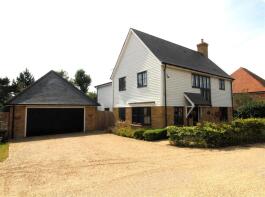
The majority of properties sold in Cliffsend during the last year were detached properties, selling for an average price of £414,762. Semi-detached properties sold for an average of £292,000, with terraced properties fetching £259,000.
Overall, the historical sold prices in Cliffsend over the last year were 3% up on the previous year and 12% down on the 2021 peak of £437,966.
Properties Sold
1, Sandwich Road, Ramsgate CT12 5HX
| Today | See what it's worth now |
| 24 Apr 2026 | £570,000 |
| 26 Oct 2022 | £730,000 |
48, Nicholas Drive, Ramsgate CT12 5JS
| Today | See what it's worth now |
| 1 Apr 2026 | £315,000 |
| 16 Aug 2002 | £129,950 |
18, Old Hall Drive, Ramsgate CT12 5LE
| Today | See what it's worth now |
| 19 Feb 2026 | £467,500 |
| 24 Jul 2006 | £223,000 |
No other historical records.
33, Foads Hill, Cliffsend, Ramsgate CT12 5EN

| Today | See what it's worth now |
| 12 Feb 2026 | £465,000 |
No other historical records.
30, Foads Hill, Ramsgate CT12 5EN
| Today | See what it's worth now |
| 9 Jan 2026 | £350,000 |
| 20 Oct 2021 | £395,000 |
3, Beech Grove, Ramsgate CT12 5LD
| Today | See what it's worth now |
| 15 Dec 2025 | £500,000 |
| 28 Sep 2007 | £303,000 |
40, Foads Hill, Ramsgate CT12 5EN
| Today | See what it's worth now |
| 12 Dec 2025 | £290,000 |
| 30 Jun 1998 | £55,000 |
No other historical records.
83, Sandwich Road, Ramsgate CT12 5JA
| Today | See what it's worth now |
| 12 Dec 2025 | £420,000 |
| 4 Jul 2007 | £188,000 |
No other historical records.
41, Beech Grove, Cliffsend, Ramsgate CT12 5LD
| Today | See what it's worth now |
| 27 Nov 2025 | £500,000 |
No other historical records.
14, Cliffs End Road, Ramsgate CT12 5JD

| Today | See what it's worth now |
| 11 Nov 2025 | £355,000 |
| 27 Jun 2016 | £115,000 |
No other historical records.
39, Cliff View Road, Ramsgate CT12 5EE
| Today | See what it's worth now |
| 7 Nov 2025 | £375,000 |
| 7 Apr 2015 | £300,000 |
3, Clive Road, Ramsgate CT12 5EQ
| Today | See what it's worth now |
| 28 Oct 2025 | £300,000 |
| 20 Jul 2012 | £153,000 |
No other historical records.
10, Saxon Way, Cliffsend CT12 5GU
| Today | See what it's worth now |
| 7 Oct 2025 | £140,000 |
No other historical records.
42, Foads Hill, Ramsgate CT12 5EN
| Today | See what it's worth now |
| 30 Sep 2025 | £285,000 |
| 8 Feb 2008 | £165,000 |
No other historical records.
21, Cliff View Road, Cliffsend, Ramsgate CT12 5ED
| Today | See what it's worth now |
| 25 Sep 2025 | £285,000 |
No other historical records.
12, Nicholas Drive, Ramsgate CT12 5JS

| Today | See what it's worth now |
| 24 Sep 2025 | £395,000 |
| 6 May 2022 | £400,000 |
51, Earlsmead Crescent, Ramsgate CT12 5LQ
| Today | See what it's worth now |
| 24 Sep 2025 | £259,000 |
| 9 Aug 2013 | £153,000 |
No other historical records.
5, Meverall Avenue, Ramsgate CT12 5JE
| Today | See what it's worth now |
| 3 Sep 2025 | £425,000 |
| 30 Jul 2014 | £291,000 |
11, Foads Hill, Ramsgate CT12 5EL
| Today | See what it's worth now |
| 19 Aug 2025 | £465,000 |
| 23 Oct 2019 | £357,000 |
No other historical records.
16, Old Hall Drive, Ramsgate CT12 5LE
| Today | See what it's worth now |
| 19 Aug 2025 | £495,000 |
| 31 May 2016 | £335,000 |
No other historical records.
72, Foads Lane, Ramsgate CT12 5JH
| Today | See what it's worth now |
| 19 Aug 2025 | £285,000 |
| 30 Apr 2010 | £170,000 |
The Homestead, Arundel Road, Ramsgate CT12 5DZ
| Today | See what it's worth now |
| 18 Aug 2025 | £367,500 |
| 12 Dec 2014 | £277,500 |
No other historical records.
20, Bakers Field, Ramsgate CT12 5GH
| Today | See what it's worth now |
| 29 Jul 2025 | £620,000 |
| 16 Jun 2023 | £715,000 |
Source Acknowledgement: © Crown copyright. England and Wales house price data is publicly available information produced by the HM Land Registry.This material was last updated on 9 July 2026. It covers the period from 1 January 1995 to 30 April 2026 and contains property transactions which have been registered during that period. Contains HM Land Registry data © Crown copyright and database right 2026. This data is licensed under the Open Government Licence v3.0.
Disclaimer: Rightmove.co.uk provides this HM Land Registry data "as is". The burden for fitness of the data relies completely with the user and is provided for informational purposes only. No warranty, express or implied, is given relating to the accuracy of content of the HM Land Registry data and Rightmove does not accept any liability for error or omission. If you have found an error with the data or need further information please contact HM Land Registry.
Permitted Use: Viewers of this Information are granted permission to access this Crown copyright material and to download it onto electronic, magnetic, optical or similar storage media provided that such activities are for private research, study or in-house use only. Any other use of the material requires the formal written permission of Land Registry which can be requested from us, and is subject to an additional licence and associated charge.
Rightmove takes no liability for your use of, or reliance on, Rightmove's Instant Valuation due to the limitations of our tracking tool listed here. Use of this tool is taken entirely at your own risk. All rights reserved.