
House Prices in Clough
House prices in Clough have an overall average of £196,232 over the last year.
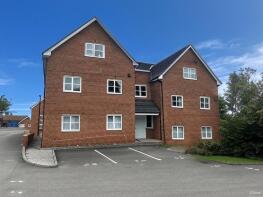
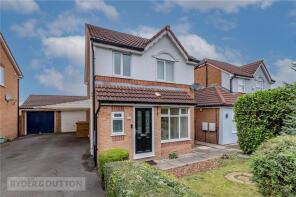
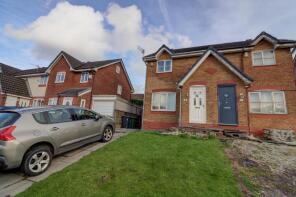
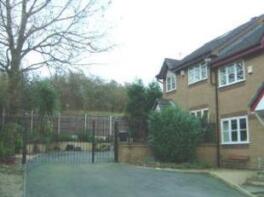
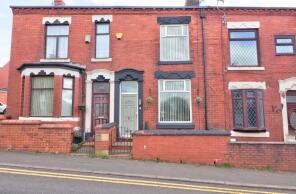
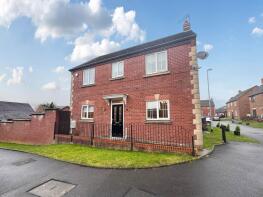
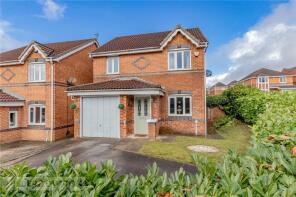
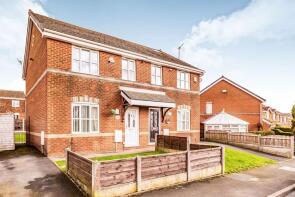
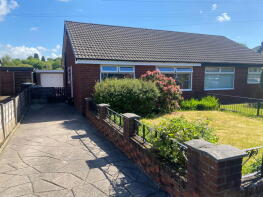
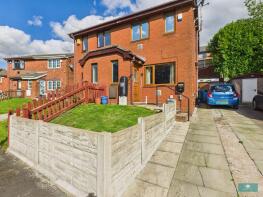
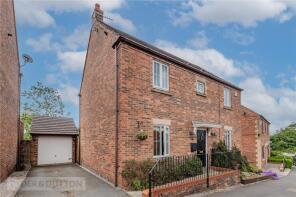
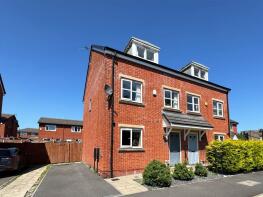
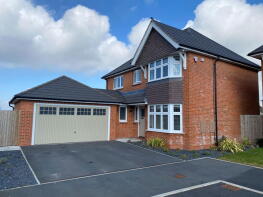
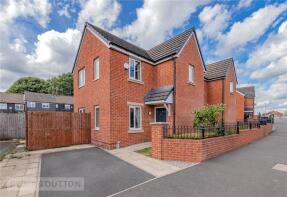
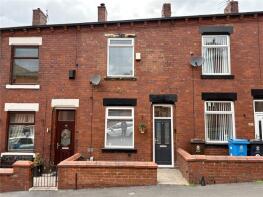
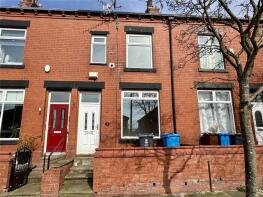
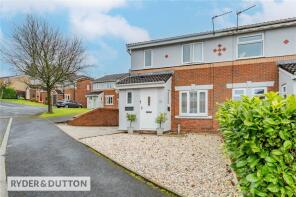
The majority of properties sold in Clough during the last year were semi-detached properties, selling for an average price of £211,869. Terraced properties sold for an average of £142,473, with detached properties fetching £310,917.
Overall, the historical sold prices in Clough over the last year were 10% up on the previous year and 15% up on the 2023 peak of £171,198.
Properties Sold
10, Saint Ambrose Court, Oldham OL1 4DJ
| Today | See what it's worth now |
| 17 Mar 2026 | £95,000 |
| 21 Nov 2023 | £65,000 |
18, Waverley Court, Waverley Street, Oldham OL1 4GA

| Today | See what it's worth now |
| 6 Mar 2026 | £95,000 |
| 4 Jan 2008 | £129,500 |
No other historical records.
15, Lower Dingle, Oldham OL1 4PB
| Today | See what it's worth now |
| 27 Feb 2026 | £253,000 |
| 15 Mar 2021 | £187,000 |
8, Higher Fullwood, Oldham OL1 4NL
| Today | See what it's worth now |
| 27 Feb 2026 | £167,500 |
| 9 Aug 2024 | £163,000 |
48, Averon Rise, Oldham OL1 4NX
| Today | See what it's worth now |
| 27 Feb 2026 | £245,000 |
| 16 Feb 2007 | £150,000 |
364, Ripponden Road, Oldham OL4 2NU
| Today | See what it's worth now |
| 25 Feb 2026 | £122,000 |
| 16 Feb 2018 | £85,000 |
1, Pilgrim Way, Oldham OL1 4TP
| Today | See what it's worth now |
| 25 Feb 2026 | £310,000 |
| 6 Oct 2016 | £173,000 |
78, Hodge Clough Road, Oldham OL1 4PW
| Today | See what it's worth now |
| 20 Feb 2026 | £280,000 |
| 8 Mar 2019 | £192,500 |
114, Hodge Clough Road, Oldham OL1 4PW
| Today | See what it's worth now |
| 6 Feb 2026 | £210,000 |
| 5 Jul 2019 | £130,500 |
No other historical records.
4, Tilton Street, Oldham OL1 4JA
| Today | See what it's worth now |
| 6 Feb 2026 | £187,000 |
No other historical records.
50, Bottomfield Close, Oldham OL1 4AT
| Today | See what it's worth now |
| 4 Feb 2026 | £177,000 |
No other historical records.
29, Goldsworth Road, Oldham OL1 4TH
| Today | See what it's worth now |
| 3 Feb 2026 | £333,000 |
| 27 Jan 2006 | £209,950 |
8, Ramsey Street, Oldham OL1 4FH
| Today | See what it's worth now |
| 30 Jan 2026 | £230,000 |
| 27 Feb 2015 | £129,995 |
No other historical records.
16, Celandine Close, Oldham OL4 2AY
| Today | See what it's worth now |
| 19 Jan 2026 | £480,000 |
| 31 Mar 2022 | £414,995 |
No other historical records.
33, London Road, Oldham OL1 4BJ
| Today | See what it's worth now |
| 19 Jan 2026 | £200,000 |
| 24 Apr 2015 | £116,995 |
No other historical records.
45, Rixson Street, Oldham OL4 2NX
| Today | See what it's worth now |
| 9 Jan 2026 | £150,000 |
| 15 Jul 2022 | £134,000 |
19, Albany Street, Oldham OL4 2NT
| Today | See what it's worth now |
| 8 Jan 2026 | £110,000 |
| 24 Oct 2003 | £195,000 |
No other historical records.
12, Mellodew Drive, Oldham OL1 4QE
| Today | See what it's worth now |
| 18 Dec 2025 | £240,000 |
| 8 Sep 2020 | £160,000 |
9, Hopkin Avenue, Oldham OL1 4DX
| Today | See what it's worth now |
| 15 Dec 2025 | £181,000 |
| 4 Feb 2014 | £62,000 |
No other historical records.
2, Goya Rise, Oldham OL1 4PT
| Today | See what it's worth now |
| 12 Dec 2025 | £142,000 |
| 28 Feb 2023 | £100,000 |
494, Ripponden Road, Oldham OL4 2LL
| Today | See what it's worth now |
| 10 Dec 2025 | £229,950 |
No other historical records.
3, Keats Road, Oldham OL1 4LR
| Today | See what it's worth now |
| 5 Dec 2025 | £125,000 |
No other historical records.
10, Chepstow Drive, Oldham OL1 4TF
| Today | See what it's worth now |
| 5 Dec 2025 | £200,000 |
| 31 Jan 2001 | £49,950 |
No other historical records.
12, Averon Rise, Oldham OL1 4NX
| Today | See what it's worth now |
| 5 Dec 2025 | £245,500 |
| 20 Apr 2023 | £190,000 |
26, Hayle Road, Oldham OL1 4NW
| Today | See what it's worth now |
| 1 Dec 2025 | £215,000 |
| 12 Oct 1995 | £43,250 |
No other historical records.
Source Acknowledgement: © Crown copyright. England and Wales house price data is publicly available information produced by the HM Land Registry.This material was last updated on 15 May 2026. It covers the period from 1 January 1995 to 31 March 2026 and contains property transactions which have been registered during that period. Contains HM Land Registry data © Crown copyright and database right 2026. This data is licensed under the Open Government Licence v3.0.
Disclaimer: Rightmove.co.uk provides this HM Land Registry data "as is". The burden for fitness of the data relies completely with the user and is provided for informational purposes only. No warranty, express or implied, is given relating to the accuracy of content of the HM Land Registry data and Rightmove does not accept any liability for error or omission. If you have found an error with the data or need further information please contact HM Land Registry.
Permitted Use: Viewers of this Information are granted permission to access this Crown copyright material and to download it onto electronic, magnetic, optical or similar storage media provided that such activities are for private research, study or in-house use only. Any other use of the material requires the formal written permission of Land Registry which can be requested from us, and is subject to an additional licence and associated charge.
Map data ©OpenStreetMap contributors.
Rightmove takes no liability for your use of, or reliance on, Rightmove's Instant Valuation due to the limitations of our tracking tool listed here. Use of this tool is taken entirely at your own risk. All rights reserved.