
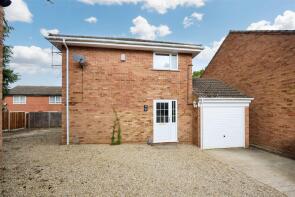
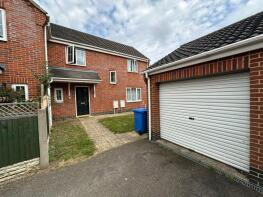
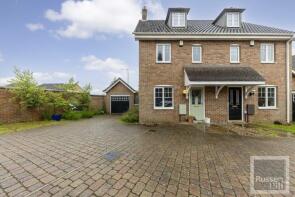
House Prices in Cloverhill
House prices in Cloverhill have an overall average of £243,303 over the last year.
The majority of properties sold in Cloverhill during the last year were semi-detached properties, selling for an average price of £231,993. Detached properties sold for an average of £283,917, with terraced properties fetching £218,417.
Overall, the historical sold prices in Cloverhill over the last year were similar to the previous year and 1% up on the 2022 peak of £240,388.
Properties Sold
5, Stylman Road, Norwich NR5 9ET
| Today | See what it's worth now |
| 13 Jun 2025 | £250,000 |
| 10 May 2021 | £197,500 |
3, Mosely Court, Norwich NR5 9PN
| Today | See what it's worth now |
| 6 Jun 2025 | £348,000 |
| 16 Sep 2022 | £330,000 |
73, Swafield Street, Norwich NR5 9EA
| Today | See what it's worth now |
| 29 May 2025 | £203,000 |
| 30 Jul 2018 | £148,000 |
18, Notykin Street, Norwich NR5 9DN

| Today | See what it's worth now |
| 22 May 2025 | £220,000 |
| 6 Dec 2021 | £198,000 |
55, Harpsfield, Norwich NR5 9LG
| Today | See what it's worth now |
| 9 May 2025 | £265,000 |
| 29 Mar 1996 | £49,995 |
No other historical records.
43, Holworthy Road, Norwich NR5 9DG
| Today | See what it's worth now |
| 8 May 2025 | £275,000 |
| 3 Apr 2003 | £135,000 |
8, Mosely Court, Norwich NR5 9PN
| Today | See what it's worth now |
| 7 May 2025 | £235,000 |
| 20 Oct 2004 | £138,000 |
No other historical records.
30, Attelsey Way, Norwich NR5 9EP
| Today | See what it's worth now |
| 17 Apr 2025 | £260,000 |
| 20 Nov 2020 | £225,000 |
20, Cotterall Court, Norwich NR5 9AZ
| Today | See what it's worth now |
| 11 Apr 2025 | £140,000 |
No other historical records.
3, William Childerhouse Way, Norwich NR5 9LY
| Today | See what it's worth now |
| 28 Mar 2025 | £281,000 |
| 11 Jan 2016 | £238,000 |
29, Mawkin Close, Norwich NR5 9PT
| Today | See what it's worth now |
| 27 Mar 2025 | £310,000 |
| 22 Dec 2005 | £189,000 |
No other historical records.
18, William Childerhouse Way, Norwich NR5 9LY
| Today | See what it's worth now |
| 25 Mar 2025 | £247,000 |
| 8 Jun 2006 | £166,000 |
16, Reydon Close, Norwich NR5 9AG
| Today | See what it's worth now |
| 21 Mar 2025 | £235,000 |
| 7 Apr 2017 | £175,000 |
No other historical records.
150, Beloe Avenue, Norwich NR5 9AQ
| Today | See what it's worth now |
| 14 Mar 2025 | £217,500 |
| 14 Jan 2019 | £183,500 |
No other historical records.
18, Tesmonde Close, Norwich NR5 9FA
| Today | See what it's worth now |
| 12 Mar 2025 | £238,500 |
| 29 Oct 2010 | £156,000 |
7, Holworthy Road, Norwich NR5 9DG
| Today | See what it's worth now |
| 7 Mar 2025 | £230,000 |
| 15 Jan 2021 | £172,000 |
No other historical records.
2, Hemmings Close, Norwich NR5 9EH
| Today | See what it's worth now |
| 28 Feb 2025 | £235,000 |
| 28 Nov 2018 | £170,000 |
51, Braithwait Close, Norwich NR5 9EJ
| Today | See what it's worth now |
| 27 Feb 2025 | £230,000 |
| 23 Aug 2002 | £89,950 |
No other historical records.
37, Howlett Drive, Norwich NR5 9BZ
| Today | See what it's worth now |
| 21 Feb 2025 | £250,000 |
No other historical records.
11, Drury Close, Norwich NR5 9DD
| Today | See what it's worth now |
| 21 Feb 2025 | £220,000 |
No other historical records.
8, The Swale, Norwich NR5 9HE
| Today | See what it's worth now |
| 14 Feb 2025 | £375,000 |
| 22 Jan 2021 | £318,000 |
8, Peverell Road, Norwich NR5 9AT
| Today | See what it's worth now |
| 14 Feb 2025 | £235,000 |
| 24 Mar 2000 | £55,000 |
No other historical records.
17, William Childerhouse Way, Norwich NR5 9LY
| Today | See what it's worth now |
| 31 Jan 2025 | £280,000 |
| 3 Aug 2020 | £235,000 |
4, Lushington Close, Norwich NR5 9AU
| Today | See what it's worth now |
| 31 Jan 2025 | £220,000 |
| 4 Feb 2021 | £172,000 |
20, Lushington Close, Norwich NR5 9AU
| Today | See what it's worth now |
| 28 Jan 2025 | £222,000 |
| 6 Dec 2001 | £69,000 |
Get ready with a Mortgage in Principle
- Personalised result in just 20 minutes
- Find out how much you can borrow
- Get viewings faster with agents
- No impact on your credit score
What's your property worth?
Source Acknowledgement: © Crown copyright. England and Wales house price data is publicly available information produced by the HM Land Registry.This material was last updated on 6 August 2025. It covers the period from 1 January 1995 to 30 June 2025 and contains property transactions which have been registered during that period. Contains HM Land Registry data © Crown copyright and database right 2025. This data is licensed under the Open Government Licence v3.0.
Disclaimer: Rightmove.co.uk provides this HM Land Registry data "as is". The burden for fitness of the data relies completely with the user and is provided for informational purposes only. No warranty, express or implied, is given relating to the accuracy of content of the HM Land Registry data and Rightmove does not accept any liability for error or omission. If you have found an error with the data or need further information please contact HM Land Registry.
Permitted Use: Viewers of this Information are granted permission to access this Crown copyright material and to download it onto electronic, magnetic, optical or similar storage media provided that such activities are for private research, study or in-house use only. Any other use of the material requires the formal written permission of Land Registry which can be requested from us, and is subject to an additional licence and associated charge.
Map data ©OpenStreetMap contributors.
Rightmove takes no liability for your use of, or reliance on, Rightmove's Instant Valuation due to the limitations of our tracking tool listed here. Use of this tool is taken entirely at your own risk. All rights reserved.