
House Prices in CM3
House prices in CM3 have an overall average of £494,152 over the last year.
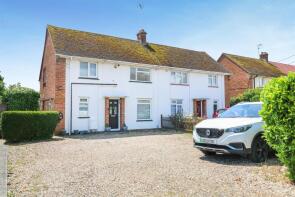
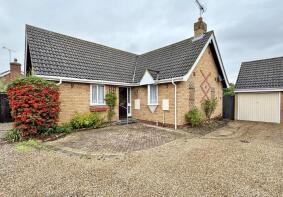
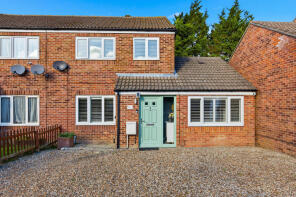
The majority of properties sold in CM3 during the last year were detached properties, selling for an average price of £627,681. Semi-detached properties sold for an average of £415,223, with terraced properties fetching £353,827.
Overall, the historical sold prices in CM3 over the last year were 3% down on the previous year and 3% down on the 2022 peak of £510,489.
Properties Sold
New Austral House, Burnham Road, Chelmsford CM3 6DP
| Today | See what it's worth now |
| 27 Apr 2026 | £615,000 |
| 8 Feb 2019 | £509,000 |
7, Ingelrica Avenue, Chelmsford CM3 2RW
| Today | See what it's worth now |
| 17 Apr 2026 | £525,000 |
| 24 Jan 2018 | £420,000 |
Herons, Waltham Road, Boreham, Chelmsford CM3 3AX
| Today | See what it's worth now |
| 17 Apr 2026 | £461,500 |
No other historical records.
Extensions and planning permission in CM3
See planning approval stats, extension build costs and value added estimates.

4, Berry Vale, South Woodham Ferrers, Chelmsford CM3 5GY
| Today | See what it's worth now |
| 17 Apr 2026 | £390,000 |
| 15 Dec 2000 | £99,500 |
8, Ormonds Crescent, Woodham Ferrers, Chelmsford CM3 8RL
| Today | See what it's worth now |
| 16 Apr 2026 | £470,000 |
| 16 Feb 2018 | £358,000 |
3, Fillioll Close, East Hanningfield, Chelmsford CM3 8UY
| Today | See what it's worth now |
| 16 Apr 2026 | £185,000 |
| 5 Mar 2021 | £170,000 |
22, Catherines Close, Great Leighs, Chelmsford CM3 1RX
| Today | See what it's worth now |
| 16 Apr 2026 | £287,000 |
| 22 May 2019 | £260,000 |
4, Elizabeth Way, Chelmsford CM3 2RU
| Today | See what it's worth now |
| 15 Apr 2026 | £320,000 |
| 13 Jun 2019 | £270,000 |
Whispering Trees, Mayland Green, Chelmsford CM3 6BD
| Today | See what it's worth now |
| 14 Apr 2026 | £520,000 |
| 2 Jul 2014 | £260,000 |
No other historical records.
2, Elm Way, Chelmsford CM3 6GP

| Today | See what it's worth now |
| 10 Apr 2026 | £545,000 |
| 1 Mar 2019 | £555,000 |
No other historical records.
63, The Chase, Boreham, Chelmsford CM3 3DF
| Today | See what it's worth now |
| 10 Apr 2026 | £400,000 |
| 25 Sep 2015 | £270,000 |
38, Woodfield Way, Chelmsford CM3 2RY
| Today | See what it's worth now |
| 10 Apr 2026 | £377,500 |
| 15 Apr 2004 | £235,000 |
No other historical records.
4, Scarles Croft, The Tye, East Hanningfield, Chelmsford CM3 8AF
| Today | See what it's worth now |
| 10 Apr 2026 | £480,000 |
| 27 Apr 2012 | £333,000 |
No other historical records.
35, Boleyn Way, Boreham, Chelmsford CM3 3JJ
| Today | See what it's worth now |
| 10 Apr 2026 | £400,000 |
| 8 Jul 2024 | £370,000 |
Southdene, South Hanningfield Road, Rettendon, Chelmsford CM3 8HE

| Today | See what it's worth now |
| 9 Apr 2026 | £820,000 |
| 12 Sep 2025 | £550,000 |
23a, Katonia Avenue, Chelmsford CM3 6AD

| Today | See what it's worth now |
| 8 Apr 2026 | £218,050 |
| 22 Jul 2022 | £400,000 |
147, Hullbridge Road, South Woodham Ferrers, Chelmsford CM3 5LL
| Today | See what it's worth now |
| 31 Mar 2026 | £535,000 |
| 31 May 2023 | £500,000 |
54, Drywoods, South Woodham Ferrers, Chelmsford CM3 5ZG
| Today | See what it's worth now |
| 31 Mar 2026 | £440,000 |
| 17 Aug 2020 | £372,500 |
2, Hillside Cottages, North Hill, Little Baddow, Chelmsford CM3 4TE
| Today | See what it's worth now |
| 30 Mar 2026 | £250,000 |
No other historical records.
25, Bucklebury Heath, South Woodham Ferrers, Chelmsford CM3 5ZU
| Today | See what it's worth now |
| 30 Mar 2026 | £405,000 |
| 10 Jun 2016 | £300,000 |
No other historical records.
63, Ormesby Chine, South Woodham Ferrers, Chelmsford CM3 7AR
| Today | See what it's worth now |
| 30 Mar 2026 | £510,000 |
| 31 May 2017 | £400,000 |
36, Brickbarns, Great Leighs, Chelmsford CM3 1JL
| Today | See what it's worth now |
| 27 Mar 2026 | £580,000 |
| 3 Aug 2018 | £505,000 |
71, Bramley Way, Chelmsford CM3 6ES
| Today | See what it's worth now |
| 27 Mar 2026 | £310,000 |
| 25 Jul 2003 | £143,500 |
Source Acknowledgement: © Crown copyright. England and Wales house price data is publicly available information produced by the HM Land Registry.This material was last updated on 9 July 2026. It covers the period from 1 January 1995 to 30 April 2026 and contains property transactions which have been registered during that period. Contains HM Land Registry data © Crown copyright and database right 2026. This data is licensed under the Open Government Licence v3.0.
Disclaimer: Rightmove.co.uk provides this HM Land Registry data "as is". The burden for fitness of the data relies completely with the user and is provided for informational purposes only. No warranty, express or implied, is given relating to the accuracy of content of the HM Land Registry data and Rightmove does not accept any liability for error or omission. If you have found an error with the data or need further information please contact HM Land Registry.
Permitted Use: Viewers of this Information are granted permission to access this Crown copyright material and to download it onto electronic, magnetic, optical or similar storage media provided that such activities are for private research, study or in-house use only. Any other use of the material requires the formal written permission of Land Registry which can be requested from us, and is subject to an additional licence and associated charge.
Rightmove takes no liability for your use of, or reliance on, Rightmove's Instant Valuation due to the limitations of our tracking tool listed here. Use of this tool is taken entirely at your own risk. All rights reserved.