
House Prices in Codmore Hill
House prices in Codmore Hill have an overall average of £663,611 over the last year.
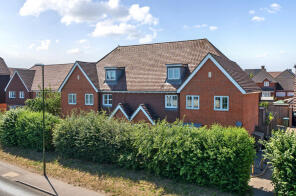
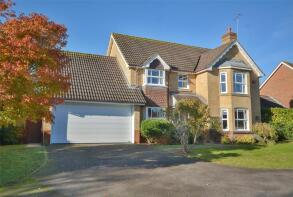
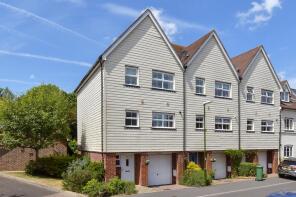
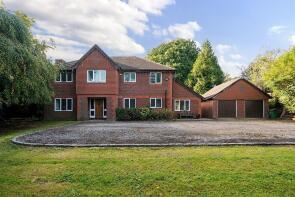
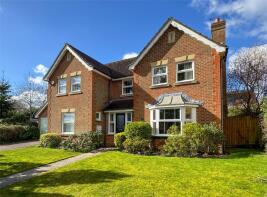
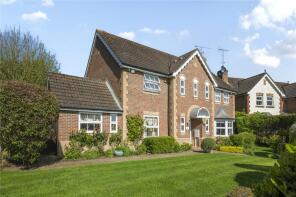
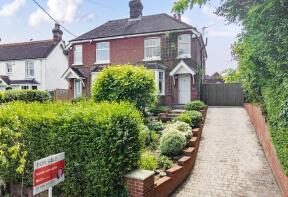
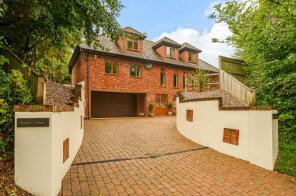
The majority of properties sold in Codmore Hill during the last year were detached properties, selling for an average price of £875,000. Terraced properties sold for an average of £394,167, with semi-detached properties fetching £415,000.
Overall, the historical sold prices in Codmore Hill over the last year were 26% up on the previous year and 3% up on the 2022 peak of £646,000.
Properties Sold
13, Oddstones, Codmore Hill, Pulborough RH20 1FS
| Today | See what it's worth now |
| 31 Mar 2026 | £375,000 |
| 3 Jun 2016 | £295,000 |
28, Masons Way, Pulborough RH20 1DZ
| Today | See what it's worth now |
| 20 Mar 2026 | £830,000 |
| 27 Jun 1997 | £205,000 |
No other historical records.
20, Riverside, Pulborough RH20 1FJ
| Today | See what it's worth now |
| 26 Feb 2026 | £400,000 |
| 19 Jul 2012 | £320,000 |
Gomera, Stane Street, Pulborough RH20 1BG

| Today | See what it's worth now |
| 12 Dec 2025 | £720,000 |
| 31 Jul 2002 | £395,000 |
No other historical records.
Chestnut Holt, Stane Street, Pulborough RH20 1BG
| Today | See what it's worth now |
| 9 Dec 2025 | £925,000 |
| 2 Nov 2016 | £775,000 |
No other historical records.
14, Masons Way, Pulborough RH20 1DZ
| Today | See what it's worth now |
| 8 Oct 2025 | £760,000 |
| 27 Oct 1995 | £194,950 |
No other historical records.
27, Corden Place, Codmore Hill, Pulborough RH20 1FQ
| Today | See what it's worth now |
| 30 Sep 2025 | £415,000 |
| 26 Feb 2021 | £414,000 |
No other historical records.
Broxbury Meadow, Broomers Hill Lane, Codmore Hill RH20 2HY
| Today | See what it's worth now |
| 18 Jul 2025 | £1,140,000 |
No other historical records.
53, Corden Place, Codmore Hill, Pulborough RH20 1FQ
| Today | See what it's worth now |
| 4 Jul 2025 | £407,500 |
| 23 Apr 2021 | £370,000 |
No other historical records.
52, Stane Street Close, Codmore Hill, Pulborough RH20 1BD
| Today | See what it's worth now |
| 16 Jun 2025 | £160,000 |
| 24 Feb 2023 | £130,000 |
No other historical records.
5, Sinclair Drive, Codmore Hill, Pulborough RH20 1FW
| Today | See what it's worth now |
| 30 Mar 2025 | £345,000 |
| 17 Dec 2021 | £340,000 |
No other historical records.
Hill House, Stane Street, Pulborough RH20 1BQ
| Today | See what it's worth now |
| 28 Mar 2025 | £665,000 |
| 18 Nov 2003 | £390,000 |
15, Riverside, Codmore Hill RH20 1FJ
| Today | See what it's worth now |
| 28 Mar 2025 | £380,000 |
No other historical records.
38, Sinclair Drive, Codmore Hill, Pulborough RH20 1FX
| Today | See what it's worth now |
| 18 Mar 2025 | £275,000 |
| 6 Mar 2020 | £260,000 |
No other historical records.
Willow Barn, Stane Street Hollow, Stane Street, Codmore Hill RH20 1BG

| Today | See what it's worth now |
| 28 Feb 2025 | £260,000 |
| 14 Apr 2010 | £150,000 |
No other historical records.
6, Sinclair Drive, Codmore Hill, Pulborough RH20 1FX
| Today | See what it's worth now |
| 28 Feb 2025 | £575,000 |
| 12 Mar 2021 | £550,000 |
No other historical records.
21, Sinclair Drive, Codmore Hill, Pulborough RH20 1FW
| Today | See what it's worth now |
| 28 Feb 2025 | £511,000 |
| 20 Aug 2021 | £495,000 |
No other historical records.
40, Stane Street Close, Codmore Hill, Pulborough RH20 1BD
| Today | See what it's worth now |
| 3 Feb 2025 | £285,000 |
No other historical records.
The White House, Hill Farm Lane, Pulborough RH20 1BJ
| Today | See what it's worth now |
| 17 Jan 2025 | £757,500 |
| 10 Dec 1998 | £215,000 |
No other historical records.
1, Masons Way, Pulborough RH20 1DZ
| Today | See what it's worth now |
| 14 Jan 2025 | £770,000 |
| 7 Sep 2004 | £427,500 |
Highview, Hill Farm Lane, Codmore Hill RH20 1BW

| Today | See what it's worth now |
| 6 Dec 2024 | £875,000 |
No other historical records.
Holly Cottage, Hill Farm Lane, Pulborough RH20 1BJ
| Today | See what it's worth now |
| 27 Nov 2024 | £515,000 |
| 20 Aug 2019 | £400,000 |
16, Masons Way, Pulborough RH20 1DZ

| Today | See what it's worth now |
| 30 Oct 2024 | £795,000 |
| 22 Oct 2012 | £462,000 |

Source Acknowledgement: © Crown copyright. England and Wales house price data is publicly available information produced by the HM Land Registry.This material was last updated on 9 July 2026. It covers the period from 1 January 1995 to 30 April 2026 and contains property transactions which have been registered during that period. Contains HM Land Registry data © Crown copyright and database right 2026. This data is licensed under the Open Government Licence v3.0.
Disclaimer: Rightmove.co.uk provides this HM Land Registry data "as is". The burden for fitness of the data relies completely with the user and is provided for informational purposes only. No warranty, express or implied, is given relating to the accuracy of content of the HM Land Registry data and Rightmove does not accept any liability for error or omission. If you have found an error with the data or need further information please contact HM Land Registry.
Permitted Use: Viewers of this Information are granted permission to access this Crown copyright material and to download it onto electronic, magnetic, optical or similar storage media provided that such activities are for private research, study or in-house use only. Any other use of the material requires the formal written permission of Land Registry which can be requested from us, and is subject to an additional licence and associated charge.
Rightmove takes no liability for your use of, or reliance on, Rightmove's Instant Valuation due to the limitations of our tracking tool listed here. Use of this tool is taken entirely at your own risk. All rights reserved.