
House Prices in Congleton
House prices in Congleton have an overall average of £291,299 over the last year.
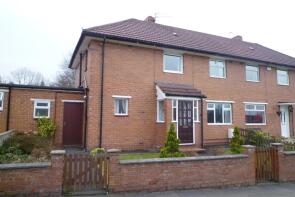
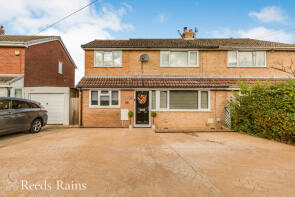
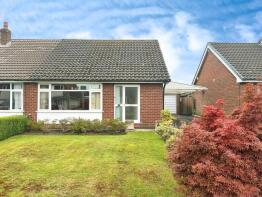
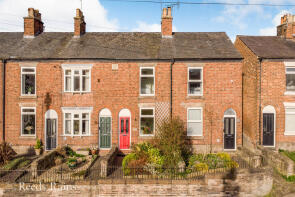
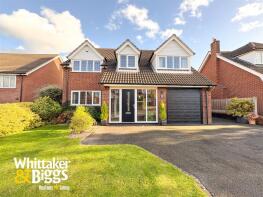
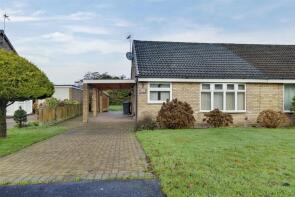
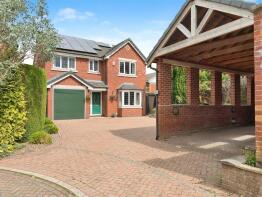
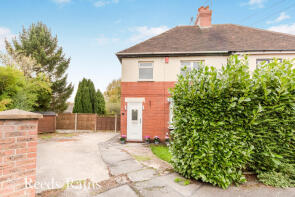
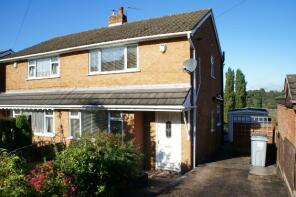
The majority of properties sold in Congleton during the last year were detached properties, selling for an average price of £420,565. Semi-detached properties sold for an average of £262,842, with terraced properties fetching £191,593.
Overall, the historical sold prices in Congleton over the last year were 9% down on the previous year and 5% down on the 2022 peak of £306,530.
Properties Sold
4, Edinburgh Place, Edinburgh Road, Congleton CW12 3DX
| Today | See what it's worth now |
| 17 Apr 2026 | £230,000 |
| 23 Aug 2013 | £88,500 |
No other historical records.
16, Moody Street, Congleton CW12 4AP
| Today | See what it's worth now |
| 17 Apr 2026 | £284,000 |
| 29 Nov 2023 | £250,000 |
10, Crayford Avenue, Congleton CW12 2BW
| Today | See what it's worth now |
| 17 Apr 2026 | £272,500 |
| 13 Mar 2020 | £192,000 |
13, Ullswater Road, Congleton CW12 4LX
| Today | See what it's worth now |
| 16 Apr 2026 | £202,000 |
| 12 May 2010 | £154,000 |
No other historical records.
Apartment 22, 21 Dane Court, Mill Green, Congleton CW12 1FS
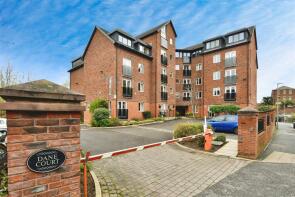
| Today | See what it's worth now |
| 16 Apr 2026 | £120,000 |
| 29 Jan 2018 | £125,000 |
4, Ash Grove, Congleton CW12 4PN
| Today | See what it's worth now |
| 13 Apr 2026 | £279,250 |
| 15 Dec 2023 | £200,000 |
67, Brook Street, Congleton CW12 1RD
| Today | See what it's worth now |
| 13 Apr 2026 | £175,000 |
| 14 Apr 2004 | £89,000 |
2c, Heath Road, Congleton CW12 4LF
| Today | See what it's worth now |
| 10 Apr 2026 | £270,000 |
| 3 Dec 2004 | £133,000 |
No other historical records.
11, Bilberry Way, Congleton CW12 4YP
| Today | See what it's worth now |
| 8 Apr 2026 | £269,000 |
| 30 Sep 2022 | £229,995 |
No other historical records.
23, Brooklands Road, Congleton CW12 4LT

| Today | See what it's worth now |
| 7 Apr 2026 | £225,000 |
No other historical records.
Pear Tree Bank, 70, Canal Road, Congleton CW12 3AN
| Today | See what it's worth now |
| 31 Mar 2026 | £192,000 |
| 20 Aug 1999 | £45,000 |
5, Tudor Way, Congleton CW12 4AS
| Today | See what it's worth now |
| 31 Mar 2026 | £500,000 |
| 29 Aug 2006 | £320,000 |
No other historical records.
19, Ginkgo Grove, Congleton CW12 4ZL

| Today | See what it's worth now |
| 27 Mar 2026 | £256,000 |
| 18 Dec 2020 | £236,000 |
No other historical records.
75, Mill Green, Congleton CW12 1GD

| Today | See what it's worth now |
| 26 Mar 2026 | £170,000 |
| 22 Dec 2005 | £129,950 |
No other historical records.
94, Chestnut Drive, Congleton CW12 4UB
| Today | See what it's worth now |
| 20 Mar 2026 | £230,000 |
No other historical records.
5, Lilac Court, Congleton CW12 3DW
| Today | See what it's worth now |
| 20 Mar 2026 | £451,000 |
| 14 Oct 2022 | £432,000 |
23, Orchard Gardens, Apple Close, Congleton CW12 4RZ
| Today | See what it's worth now |
| 20 Mar 2026 | £107,000 |
| 9 Jun 2016 | £115,000 |
19, Whitebeam Close, Congleton CW12 1GH
| Today | See what it's worth now |
| 20 Mar 2026 | £150,000 |
| 15 Aug 2025 | £430,000 |
124, St Johns Road, Congleton CW12 2AX
| Today | See what it's worth now |
| 19 Mar 2026 | £210,000 |
| 20 Apr 2011 | £105,000 |
No other historical records.
24, Park Lane, Congleton CW12 3DG
| Today | See what it's worth now |
| 18 Mar 2026 | £637,000 |
| 23 Oct 2015 | £295,000 |
19, Jubilee Road, Congleton CW12 3AJ
| Today | See what it's worth now |
| 16 Mar 2026 | £186,000 |
| 27 Jul 2007 | £165,000 |
5, Campbell Close, Congleton CW12 2BQ
| Today | See what it's worth now |
| 13 Mar 2026 | £207,500 |
| 7 Aug 2009 | £124,000 |
77, Astbury Street, Congleton CW12 4EG

| Today | See what it's worth now |
| 13 Mar 2026 | £145,686 |
| 8 May 2017 | £117,000 |

Source Acknowledgement: © Crown copyright. England and Wales house price data is publicly available information produced by the HM Land Registry.This material was last updated on 9 July 2026. It covers the period from 1 January 1995 to 30 April 2026 and contains property transactions which have been registered during that period. Contains HM Land Registry data © Crown copyright and database right 2026. This data is licensed under the Open Government Licence v3.0.
Disclaimer: Rightmove.co.uk provides this HM Land Registry data "as is". The burden for fitness of the data relies completely with the user and is provided for informational purposes only. No warranty, express or implied, is given relating to the accuracy of content of the HM Land Registry data and Rightmove does not accept any liability for error or omission. If you have found an error with the data or need further information please contact HM Land Registry.
Permitted Use: Viewers of this Information are granted permission to access this Crown copyright material and to download it onto electronic, magnetic, optical or similar storage media provided that such activities are for private research, study or in-house use only. Any other use of the material requires the formal written permission of Land Registry which can be requested from us, and is subject to an additional licence and associated charge.
Rightmove takes no liability for your use of, or reliance on, Rightmove's Instant Valuation due to the limitations of our tracking tool listed here. Use of this tool is taken entirely at your own risk. All rights reserved.