
House Prices in Cornmore
House prices in Cornmore have an overall average of £312,935 over the last year.
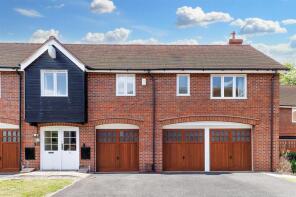
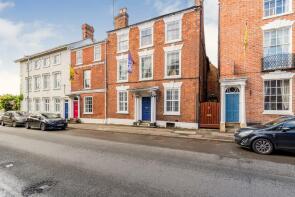
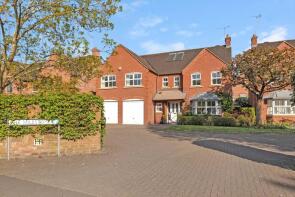
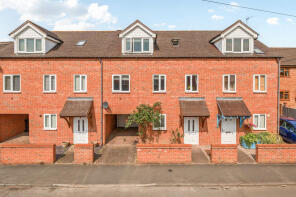
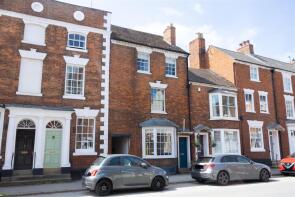
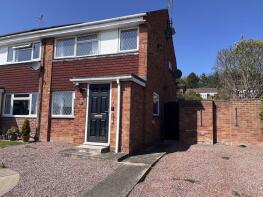
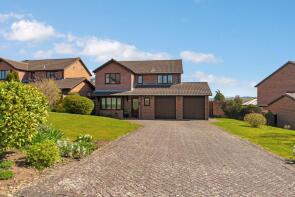
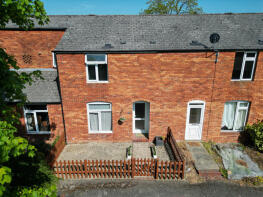
The majority of properties sold in Cornmore during the last year were terraced properties, selling for an average price of £269,938. Detached properties sold for an average of £460,654, with semi-detached properties fetching £298,000.
Overall, the historical sold prices in Cornmore over the last year were 3% down on the previous year and 12% up on the 2021 peak of £279,000.
Properties Sold
4, Pippin Close, Pershore WR10 1BF
| Today | See what it's worth now |
| 14 Apr 2026 | £220,000 |
| 12 Mar 2024 | £230,000 |
No other historical records.
Apartment 1, Chase Mews, Head Street, Pershore WR10 1DR
| Today | See what it's worth now |
| 1 Apr 2026 | £129,000 |
| 21 Dec 2016 | £99,950 |
127, High Street, Pershore WR10 1EQ
| Today | See what it's worth now |
| 30 Mar 2026 | £140,000 |
| 11 Jun 1999 | £57,500 |
5, Beechcombe Close, Pershore WR10 1PW
| Today | See what it's worth now |
| 12 Mar 2026 | £330,000 |
| 16 Jul 1998 | £98,500 |
34, St Andrews Road, Pershore WR10 1LT
| Today | See what it's worth now |
| 12 Mar 2026 | £285,000 |
| 13 Apr 2023 | £240,000 |
No other historical records.
26, Abbots Road, Pershore WR10 1LL
| Today | See what it's worth now |
| 10 Mar 2026 | £235,000 |
| 5 Oct 2018 | £165,000 |
6 Ayrton House, Bridge Street, Pershore WR10 1AT
| Today | See what it's worth now |
| 10 Mar 2026 | £478,500 |
| 23 Mar 2021 | £350,000 |
5, Avon Mill Place, Pershore WR10 1AZ
| Today | See what it's worth now |
| 6 Mar 2026 | £178,000 |
| 9 Oct 2014 | £140,000 |
6, Holloway Drive, Pershore WR10 1JL
| Today | See what it's worth now |
| 2 Mar 2026 | £375,000 |
| 7 Sep 2001 | £105,000 |
No other historical records.
25, Worcester Road, Pershore WR10 1HQ
| Today | See what it's worth now |
| 27 Feb 2026 | £330,000 |
No other historical records.
2, Little Penny Rope, Pershore WR10 1QN

| Today | See what it's worth now |
| 27 Feb 2026 | £510,000 |
| 17 Jul 2001 | £195,000 |
No other historical records.
7, St Agathas Road, Pershore WR10 1DG
| Today | See what it's worth now |
| 20 Feb 2026 | £220,000 |
| 28 Jun 2019 | £163,000 |
38, Loughmill Road, Pershore WR10 1QB
| Today | See what it's worth now |
| 6 Feb 2026 | £200,000 |
No other historical records.
115a, High Street, Pershore WR10 1EQ
| Today | See what it's worth now |
| 29 Jan 2026 | £250,000 |
| 26 Jan 2021 | £162,500 |
10, Avon Mill Place, Pershore WR10 1AZ
| Today | See what it's worth now |
| 16 Jan 2026 | £203,500 |
| 31 Oct 2002 | £155,000 |
No other historical records.
74 Dungannon House, Bridge Street, Pershore WR10 1AX
| Today | See what it's worth now |
| 15 Dec 2025 | £640,000 |
| 14 Apr 2021 | £550,000 |
2, The Milestone, Pershore WR10 1RF
| Today | See what it's worth now |
| 15 Dec 2025 | £629,000 |
| 9 Jul 2015 | £425,000 |
18a, Head Street, Pershore WR10 1DA
| Today | See what it's worth now |
| 11 Dec 2025 | £282,000 |
| 12 Jul 2023 | £340,000 |
54, Bridge Street, Pershore WR10 1AT
| Today | See what it's worth now |
| 11 Dec 2025 | £415,000 |
| 31 Aug 2021 | £400,000 |
70, Loughmill Road, Pershore WR10 1QB
| Today | See what it's worth now |
| 10 Dec 2025 | £262,000 |
No other historical records.
6, Mount Pleasant, Pershore WR10 1NF
| Today | See what it's worth now |
| 5 Dec 2025 | £540,000 |
No other historical records.
24, St Agathas Road, Pershore WR10 1DG
| Today | See what it's worth now |
| 3 Dec 2025 | £240,000 |
| 28 Oct 2020 | £202,000 |
17, Sebright Close, Pershore WR10 1QF
| Today | See what it's worth now |
| 28 Nov 2025 | £323,000 |
| 18 Dec 2020 | £230,000 |
No other historical records.

Source Acknowledgement: © Crown copyright. England and Wales house price data is publicly available information produced by the HM Land Registry.This material was last updated on 9 July 2026. It covers the period from 1 January 1995 to 30 April 2026 and contains property transactions which have been registered during that period. Contains HM Land Registry data © Crown copyright and database right 2026. This data is licensed under the Open Government Licence v3.0.
Disclaimer: Rightmove.co.uk provides this HM Land Registry data "as is". The burden for fitness of the data relies completely with the user and is provided for informational purposes only. No warranty, express or implied, is given relating to the accuracy of content of the HM Land Registry data and Rightmove does not accept any liability for error or omission. If you have found an error with the data or need further information please contact HM Land Registry.
Permitted Use: Viewers of this Information are granted permission to access this Crown copyright material and to download it onto electronic, magnetic, optical or similar storage media provided that such activities are for private research, study or in-house use only. Any other use of the material requires the formal written permission of Land Registry which can be requested from us, and is subject to an additional licence and associated charge.
Rightmove takes no liability for your use of, or reliance on, Rightmove's Instant Valuation due to the limitations of our tracking tool listed here. Use of this tool is taken entirely at your own risk. All rights reserved.