
House Prices in Cotwall End
House prices in Cotwall End have an overall average of £233,284 over the last year.
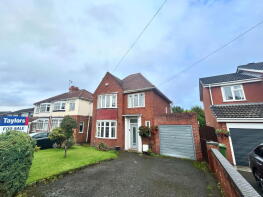
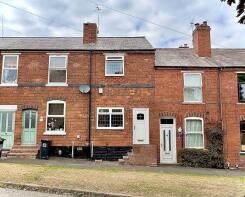
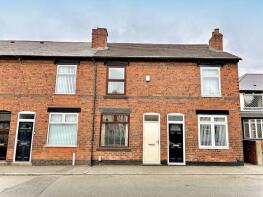
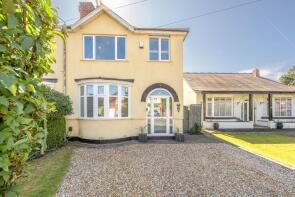
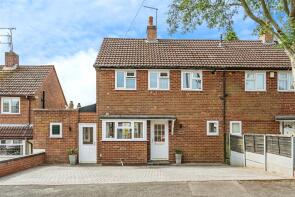
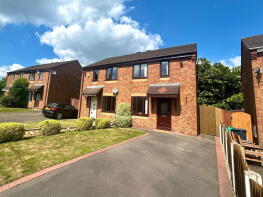
The majority of properties sold in Cotwall End during the last year were semi-detached properties, selling for an average price of £235,669. Terraced properties sold for an average of £197,636, with detached properties fetching £370,222.
Overall, the historical sold prices in Cotwall End over the last year were similar to the previous year and 8% up on the 2022 peak of £216,030.
Properties Sold
52, Bath Street, Lanesfield, Dudley DY3 1LT
| Today | See what it's worth now |
| 16 Mar 2026 | £300,000 |
| 29 Oct 1999 | £81,500 |
No other historical records.
52, Inhedge Street, Dudley DY3 1XY
| Today | See what it's worth now |
| 6 Mar 2026 | £160,000 |
| 9 Nov 2012 | £103,000 |
115, Dudley Road, Dudley DY3 1TF
| Today | See what it's worth now |
| 6 Mar 2026 | £175,000 |
| 29 Nov 2019 | £110,000 |
23, Turls Hill Road, Dudley DY3 1HQ
| Today | See what it's worth now |
| 24 Feb 2026 | £348,000 |
| 26 Jul 2024 | £192,500 |
14, Claremont Road, Dudley DY3 1HN
| Today | See what it's worth now |
| 23 Feb 2026 | £242,000 |
| 31 May 2019 | £190,000 |
8, Turls Street, Dudley DY3 1HH
| Today | See what it's worth now |
| 20 Feb 2026 | £152,000 |
| 8 May 2024 | £125,000 |
1, Board School Gardens, Dudley DY3 1XA
| Today | See what it's worth now |
| 20 Feb 2026 | £315,000 |
| 18 Feb 2022 | £270,000 |
70, Bath Street, Lanesfield, Dudley DY3 1LT
| Today | See what it's worth now |
| 20 Feb 2026 | £172,000 |
| 28 Nov 2003 | £100,000 |
No other historical records.
18, High Park Crescent, Sedgley DY3 1QZ

| Today | See what it's worth now |
| 6 Feb 2026 | £235,000 |
No other historical records.
10, Chevening Close, Sedgley DY3 1BE
| Today | See what it's worth now |
| 27 Jan 2026 | £317,000 |
No other historical records.
15, Parkes Lane, Dudley DY3 1AQ
| Today | See what it's worth now |
| 23 Jan 2026 | £250,000 |
| 21 Jun 2013 | £148,000 |
26, Bath Street, Dudley DY3 1LR
| Today | See what it's worth now |
| 23 Jan 2026 | £276,900 |
| 9 Jan 2020 | £205,000 |
8, North Oval, Dudley DY3 1XJ
| Today | See what it's worth now |
| 14 Jan 2026 | £220,000 |
| 18 Dec 2015 | £120,000 |
103, Dudley Road, Dudley DY3 1TF
| Today | See what it's worth now |
| 13 Jan 2026 | £128,000 |
| 21 Jun 2019 | £102,000 |
35, Claremont Road, Sedgley DY3 1HW
| Today | See what it's worth now |
| 19 Dec 2025 | £182,500 |
No other historical records.
4, High Park Close, Dudley DY3 1RB
| Today | See what it's worth now |
| 12 Dec 2025 | £265,000 |
| 18 Feb 2019 | £199,950 |
19, The Walk, Dudley DY3 1PN
| Today | See what it's worth now |
| 10 Dec 2025 | £202,500 |
| 25 Aug 2020 | £160,000 |
48, Roper Way, Dudley DY3 1BG
| Today | See what it's worth now |
| 5 Dec 2025 | £240,000 |
| 18 Jul 2016 | £142,950 |
4, Turls Hill Road, Dudley DY3 1HG
| Today | See what it's worth now |
| 3 Dec 2025 | £180,000 |
| 8 Feb 2019 | £122,000 |
39, Tudor Road, Dudley DY3 1TY
| Today | See what it's worth now |
| 28 Nov 2025 | £195,000 |
| 27 May 2005 | £82,000 |
No other historical records.
34, Monument Lane, Sedgley DY3 1LY
| Today | See what it's worth now |
| 27 Nov 2025 | £200,000 |
No other historical records.
21, Tenacre Lane, Dudley DY3 1XH
| Today | See what it's worth now |
| 21 Nov 2025 | £228,000 |
| 1 Jun 2022 | £175,000 |
35, Brook Street, Dudley DY3 1AD
| Today | See what it's worth now |
| 17 Nov 2025 | £285,000 |
| 28 Apr 2011 | £155,000 |
Source Acknowledgement: © Crown copyright. England and Wales house price data is publicly available information produced by the HM Land Registry.This material was last updated on 15 May 2026. It covers the period from 1 January 1995 to 31 March 2026 and contains property transactions which have been registered during that period. Contains HM Land Registry data © Crown copyright and database right 2026. This data is licensed under the Open Government Licence v3.0.
Disclaimer: Rightmove.co.uk provides this HM Land Registry data "as is". The burden for fitness of the data relies completely with the user and is provided for informational purposes only. No warranty, express or implied, is given relating to the accuracy of content of the HM Land Registry data and Rightmove does not accept any liability for error or omission. If you have found an error with the data or need further information please contact HM Land Registry.
Permitted Use: Viewers of this Information are granted permission to access this Crown copyright material and to download it onto electronic, magnetic, optical or similar storage media provided that such activities are for private research, study or in-house use only. Any other use of the material requires the formal written permission of Land Registry which can be requested from us, and is subject to an additional licence and associated charge.
Rightmove takes no liability for your use of, or reliance on, Rightmove's Instant Valuation due to the limitations of our tracking tool listed here. Use of this tool is taken entirely at your own risk. All rights reserved.