
House Prices in CR2
House prices in CR2 have an overall average of £498,643 over the last year.
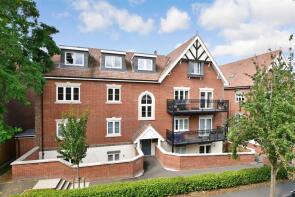
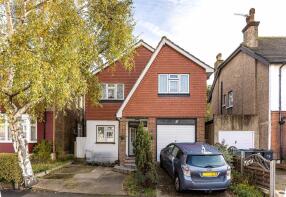
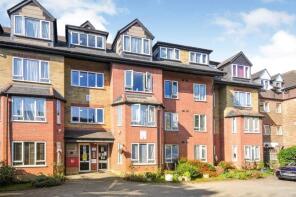
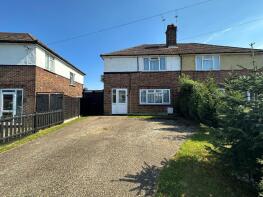
The majority of properties sold in CR2 during the last year were flats, selling for an average price of £276,312. Semi-detached properties sold for an average of £570,236, with detached properties fetching £838,672.
Overall, the historical sold prices in CR2 over the last year were similar to the previous year and 2% up on the 2022 peak of £489,674.
Properties Sold
79, Selsdon Road, South Croydon CR2 6PZ

| Today | See what it's worth now |
| 30 Apr 2026 | £480,000 |
| 27 Feb 2015 | £335,000 |
52, Croham Valley Road, South Croydon CR2 7NB
| Today | See what it's worth now |
| 28 Apr 2026 | £865,000 |
| 27 Apr 2011 | £570,000 |
1a, Blacksmiths Hill, South Croydon CR2 9AZ
| Today | See what it's worth now |
| 24 Apr 2026 | £795,000 |
| 24 Jan 1997 | £197,000 |
No other historical records.
Extensions and planning permission in CR2
See planning approval stats, extension build costs and value added estimates.

200, Limpsfield Road, South Croydon CR2 9DA
| Today | See what it's worth now |
| 24 Apr 2026 | £513,750 |
| 14 Aug 2020 | £455,000 |
No other historical records.
31, Grange Road, South Croydon CR2 0NE
| Today | See what it's worth now |
| 16 Apr 2026 | £465,000 |
| 7 Sep 2007 | £248,000 |
No other historical records.
18, Briton Crescent, South Croydon CR2 0JE
| Today | See what it's worth now |
| 16 Apr 2026 | £1,201,500 |
| 1 Aug 2016 | £890,000 |
26, Elmpark Gardens, South Croydon CR2 8RU
| Today | See what it's worth now |
| 16 Apr 2026 | £445,000 |
| 9 Jan 2003 | £199,000 |
No other historical records.
20, Rockhampton Road, South Croydon CR2 7AQ
| Today | See what it's worth now |
| 14 Apr 2026 | £710,000 |
| 3 Sep 2018 | £545,000 |
No other historical records.
29, Orchard Road, South Croydon CR2 9LY
| Today | See what it's worth now |
| 14 Apr 2026 | £612,500 |
| 16 Dec 2003 | £241,000 |
39, Blackford Close, South Croydon CR2 6BT
| Today | See what it's worth now |
| 10 Apr 2026 | £500,000 |
| 6 Aug 2010 | £325,000 |
Flat 7, 113 Oaklands, Haling Park Road, South Croydon CR2 6NN
| Today | See what it's worth now |
| 10 Apr 2026 | £172,500 |
| 18 Feb 2000 | £53,500 |
4, Princes Close, South Croydon CR2 9BP
| Today | See what it's worth now |
| 10 Apr 2026 | £595,000 |
| 28 Nov 2003 | £249,950 |
14, Sanderstead Court, Addington Road, South Croydon CR2 8RA

| Today | See what it's worth now |
| 10 Apr 2026 | £355,000 |
| 7 Sep 2018 | £406,000 |
No other historical records.
21, Whitmead Close, South Croydon CR2 7AS
| Today | See what it's worth now |
| 9 Apr 2026 | £400,000 |
| 13 Nov 2020 | £315,000 |
No other historical records.
38, Crest Road, South Croydon CR2 7JQ
| Today | See what it's worth now |
| 9 Apr 2026 | £620,000 |
| 20 Mar 1996 | £112,000 |
No other historical records.
30, Littleheath Road, South Croydon CR2 7SA
| Today | See what it's worth now |
| 8 Apr 2026 | £600,000 |
| 30 Oct 2015 | £438,750 |
85, Sanderstead Road, South Croydon CR2 0PF
| Today | See what it's worth now |
| 2 Apr 2026 | £430,000 |
| 24 Aug 2017 | £425,000 |
11, Kingsway Avenue, South Croydon CR2 8NF
| Today | See what it's worth now |
| 1 Apr 2026 | £605,000 |
| 4 Dec 2015 | £420,000 |
No other historical records.
Flat 20, 34 Tilbury Lodge, Normanton Road, South Croydon CR2 7FR
| Today | See what it's worth now |
| 31 Mar 2026 | £450,000 |
| 12 Nov 2020 | £515,000 |
No other historical records.
13a, Florence Road, South Croydon CR2 0PQ
| Today | See what it's worth now |
| 30 Mar 2026 | £570,000 |
No other historical records.
13, 44 Mill Court, Brighton Road, South Croydon CR2 6AS
| Today | See what it's worth now |
| 30 Mar 2026 | £128,000 |
| 6 Aug 2010 | £132,500 |
127, Harewood Gardens, South Croydon CR2 9BW
| Today | See what it's worth now |
| 30 Mar 2026 | £520,000 |
| 26 Jul 2019 | £410,000 |
No other historical records.
19, Helder Street, South Croydon CR2 6HT
| Today | See what it's worth now |
| 30 Mar 2026 | £385,000 |
| 26 Feb 2021 | £380,000 |
Source Acknowledgement: © Crown copyright. England and Wales house price data is publicly available information produced by the HM Land Registry.This material was last updated on 9 July 2026. It covers the period from 1 January 1995 to 30 April 2026 and contains property transactions which have been registered during that period. Contains HM Land Registry data © Crown copyright and database right 2026. This data is licensed under the Open Government Licence v3.0.
Disclaimer: Rightmove.co.uk provides this HM Land Registry data "as is". The burden for fitness of the data relies completely with the user and is provided for informational purposes only. No warranty, express or implied, is given relating to the accuracy of content of the HM Land Registry data and Rightmove does not accept any liability for error or omission. If you have found an error with the data or need further information please contact HM Land Registry.
Permitted Use: Viewers of this Information are granted permission to access this Crown copyright material and to download it onto electronic, magnetic, optical or similar storage media provided that such activities are for private research, study or in-house use only. Any other use of the material requires the formal written permission of Land Registry which can be requested from us, and is subject to an additional licence and associated charge.
Rightmove takes no liability for your use of, or reliance on, Rightmove's Instant Valuation due to the limitations of our tracking tool listed here. Use of this tool is taken entirely at your own risk. All rights reserved.