
House Prices in Crackley
House prices in Crackley have an overall average of £198,667 over the last year.
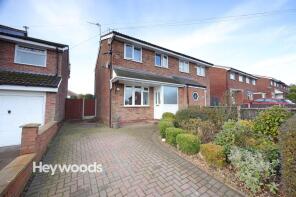
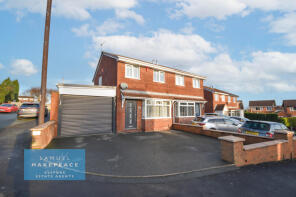
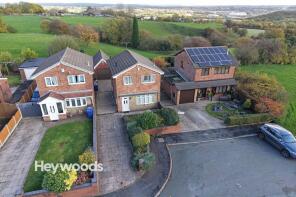
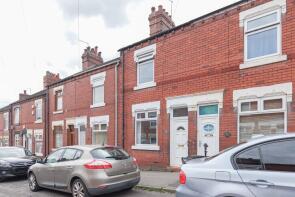
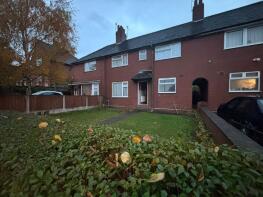
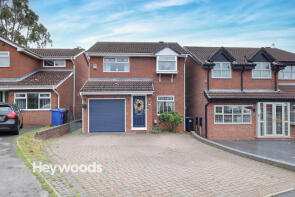
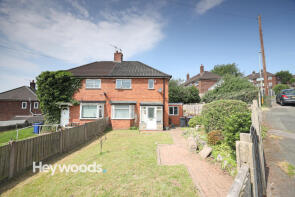
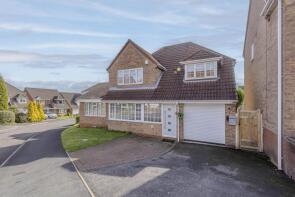
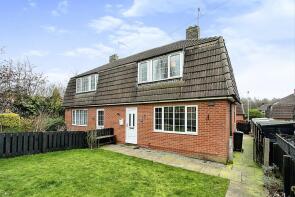
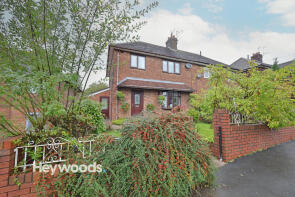
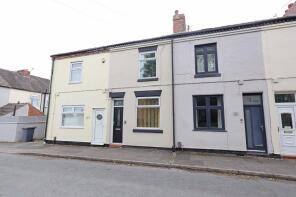
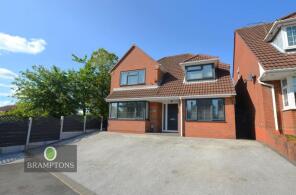
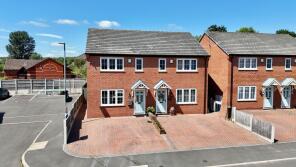
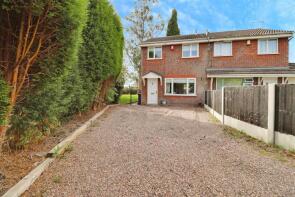
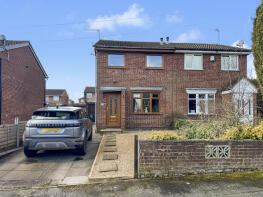
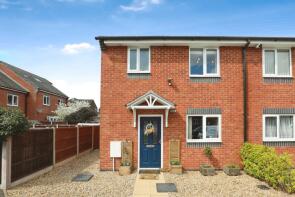
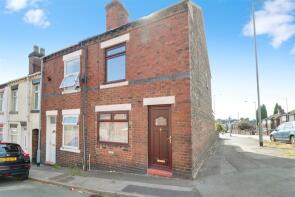
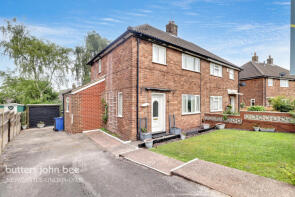
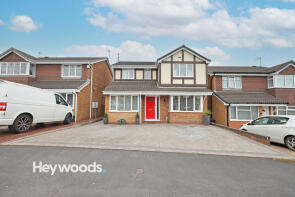
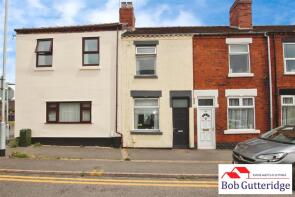
The majority of properties sold in Crackley during the last year were detached properties, selling for an average price of £280,000. Semi-detached properties sold for an average of £153,968, with terraced properties fetching £136,344.
Overall, the historical sold prices in Crackley over the last year were 11% up on the previous year and 16% up on the 2022 peak of £170,983.
Properties Sold
25, Wem Grove, Newcastle ST5 7RA
| Today | See what it's worth now |
| 20 Mar 2026 | £150,000 |
| 5 Apr 2019 | £60,000 |
20, Wenlock Close, Newcastle ST5 7QF
| Today | See what it's worth now |
| 20 Mar 2026 | £252,000 |
| 9 May 2003 | £81,000 |
No other historical records.
21, Wem Grove, Newcastle ST5 7RA
| Today | See what it's worth now |
| 20 Mar 2026 | £220,000 |
| 29 Jun 2012 | £145,000 |
13, Hodgkinson Street, Newcastle ST5 7HX
| Today | See what it's worth now |
| 13 Mar 2026 | £115,000 |
| 9 Feb 2023 | £115,000 |
34, Beasley Avenue, Newcastle Under Lyme ST5 7PE
| Today | See what it's worth now |
| 2 Mar 2026 | £102,000 |
No other historical records.
235, Crackley Bank, Newcastle ST5 7AB
| Today | See what it's worth now |
| 27 Feb 2026 | £153,000 |
| 28 Aug 1998 | £44,500 |
No other historical records.
40, Longclough Road, Newcastle Under Lyme ST5 7SW
| Today | See what it's worth now |
| 16 Feb 2026 | £250,000 |
No other historical records.
5, Constable Avenue, Newcastle ST5 7LD
| Today | See what it's worth now |
| 13 Feb 2026 | £145,000 |
| 14 Mar 2011 | £81,000 |
No other historical records.
8, Willotts Hill Road, Newcastle ST5 7TF
| Today | See what it's worth now |
| 13 Feb 2026 | £372,500 |
| 18 May 2018 | £249,950 |
No other historical records.
14, Oakwood Place, Newcastle Under Lyme ST5 7BB
| Today | See what it's worth now |
| 10 Feb 2026 | £105,000 |
No other historical records.
70, Rowley Avenue, Newcastle ST5 7NP
| Today | See what it's worth now |
| 6 Feb 2026 | £170,500 |
| 16 Jun 2016 | £105,000 |
No other historical records.
13, Edensor Street, Newcastle ST5 7EG
| Today | See what it's worth now |
| 4 Feb 2026 | £115,000 |
| 27 Nov 2020 | £103,000 |
No other historical records.
2, Water Street, Red Street, Newcastle Under Lyme ST5 7AE
| Today | See what it's worth now |
| 4 Feb 2026 | £100,000 |
No other historical records.
36, Sutton Street, Newcastle ST5 7JH

| Today | See what it's worth now |
| 30 Jan 2026 | £176,000 |
| 11 May 2007 | £116,950 |
14, Willotts Hill Road, Newcastle ST5 7TF
| Today | See what it's worth now |
| 30 Jan 2026 | £335,000 |
| 31 Jan 2025 | £335,000 |
3, Foundry Close, Newcastle ST5 7FE
| Today | See what it's worth now |
| 22 Jan 2026 | £190,000 |
| 1 Mar 2019 | £150,000 |
No other historical records.
46, Newport Grove, Newcastle ST5 7QL
| Today | See what it's worth now |
| 16 Jan 2026 | £190,000 |
| 30 Sep 2021 | £175,000 |
31, Wem Grove, Newcastle ST5 7RA
| Today | See what it's worth now |
| 7 Jan 2026 | £187,000 |
| 4 Mar 2021 | £152,000 |
5, Corona Park, Sandford Street, Newcastle ST5 7FD
| Today | See what it's worth now |
| 19 Dec 2025 | £185,000 |
| 14 Dec 2017 | £130,000 |
No other historical records.
73, Heath Street, Chesterton, Newcastle Under Lyme ST5 7PY
| Today | See what it's worth now |
| 17 Dec 2025 | £85,000 |
No other historical records.
3, Reynolds Avenue, Newcastle ST5 7JL
| Today | See what it's worth now |
| 12 Dec 2025 | £145,000 |
| 28 Jun 2002 | £39,000 |
No other historical records.
28, Wolstanton Road, Newcastle ST5 7LX

| Today | See what it's worth now |
| 5 Dec 2025 | £147,500 |
| 8 Dec 2006 | £90,000 |
No other historical records.
92, Liverpool Road, Red Street, Newcastle ST5 7AF
| Today | See what it's worth now |
| 28 Nov 2025 | £115,000 |
| 18 Jun 2021 | £93,000 |
No other historical records.
3, Eddisbury Drive, Newcastle ST5 7SL
| Today | See what it's worth now |
| 24 Nov 2025 | £307,500 |
| 13 Dec 1996 | £61,500 |
No other historical records.
80, Liverpool Road, Red Street, Newcastle ST5 7AF
| Today | See what it's worth now |
| 20 Nov 2025 | £116,000 |
| 27 Sep 2021 | £99,950 |
Source Acknowledgement: © Crown copyright. England and Wales house price data is publicly available information produced by the HM Land Registry.This material was last updated on 15 May 2026. It covers the period from 1 January 1995 to 31 March 2026 and contains property transactions which have been registered during that period. Contains HM Land Registry data © Crown copyright and database right 2026. This data is licensed under the Open Government Licence v3.0.
Disclaimer: Rightmove.co.uk provides this HM Land Registry data "as is". The burden for fitness of the data relies completely with the user and is provided for informational purposes only. No warranty, express or implied, is given relating to the accuracy of content of the HM Land Registry data and Rightmove does not accept any liability for error or omission. If you have found an error with the data or need further information please contact HM Land Registry.
Permitted Use: Viewers of this Information are granted permission to access this Crown copyright material and to download it onto electronic, magnetic, optical or similar storage media provided that such activities are for private research, study or in-house use only. Any other use of the material requires the formal written permission of Land Registry which can be requested from us, and is subject to an additional licence and associated charge.
Map data ©OpenStreetMap contributors.
Rightmove takes no liability for your use of, or reliance on, Rightmove's Instant Valuation due to the limitations of our tracking tool listed here. Use of this tool is taken entirely at your own risk. All rights reserved.