
House Prices in Craigend
House prices in Craigend have an overall average of £162,596 over the last year.
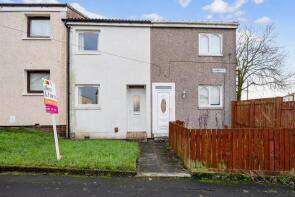
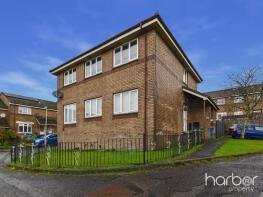
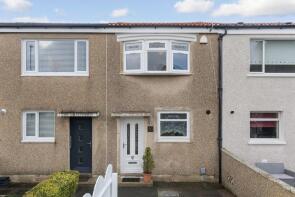
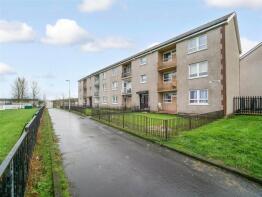
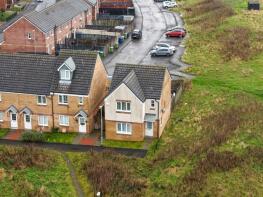
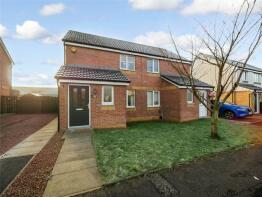
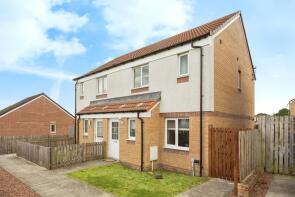
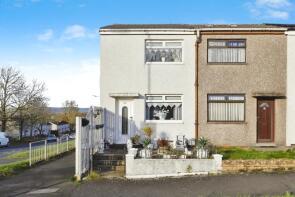
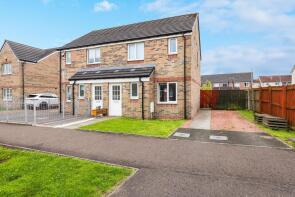
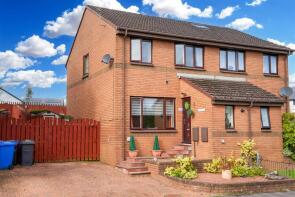
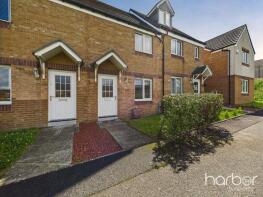
The majority of properties sold in Craigend during the last year were terraced properties, selling for an average price of £153,207. Semi-detached properties sold for an average of £204,186, with flats fetching £93,325.
Overall, the historical sold prices in Craigend over the last year were 2% down on the previous year and 16% up on the 2023 peak of £139,601.
Properties Sold
20, Cambus Place, Glasgow G33 5QH
| Today | See what it's worth now |
| 20 Apr 2026 | £137,000 |
| 12 Jun 2015 | £50,000 |
Flat 2/1, 9, Glenraith Square, Glasgow G33 5PD
| Today | See what it's worth now |
| 17 Apr 2026 | £67,500 |
No other historical records.
41, Kincardine Square, Glasgow G33 5BU

| Today | See what it's worth now |
| 15 Apr 2026 | £231,000 |
| 23 Nov 2023 | £190,000 |
33, Binns Road, Glasgow G33 5HU
| Today | See what it's worth now |
| 13 Apr 2026 | £140,000 |
| 4 Sep 2007 | £87,000 |
41, Collessie Drive, Glasgow G33 5QD
| Today | See what it's worth now |
| 13 Apr 2026 | £143,000 |
| 11 Dec 2018 | £93,000 |
Flat 0/1, 8, Mossvale Walk, Glasgow G33 5PF
| Today | See what it's worth now |
| 3 Apr 2026 | £65,000 |
| 1 Mar 2022 | £61,250 |
No other historical records.
52, Kishorn Place, Glasgow G33 5QP
| Today | See what it's worth now |
| 1 Apr 2026 | £135,000 |
| 9 Jul 2004 | £19,400 |
No other historical records.
Flat 2/1, 33, Glenraith Road, Glasgow G33 5PA

| Today | See what it's worth now |
| 1 Apr 2026 | £70,000 |
| 13 Oct 2021 | £67,000 |
12, Darnaway Drive, Glasgow G33 5HA
| Today | See what it's worth now |
| 24 Mar 2026 | £155,000 |
| 10 Apr 2007 | £94,995 |
Flat 2/1, 51, Porchester Street, Glasgow G33 5DP
| Today | See what it's worth now |
| 17 Mar 2026 | £80,000 |
| 1 Oct 2008 | £63,000 |
175, Tillycairn Drive, Glasgow G33 5HS
| Today | See what it's worth now |
| 16 Mar 2026 | £168,310 |
| 27 Jan 2020 | £120,000 |
Flat 2/2, 26, Glenraith Walk, Glasgow G33 5PE
| Today | See what it's worth now |
| 12 Mar 2026 | £73,000 |
| 27 Sep 2013 | £46,500 |
90, Tillycairn Drive, Glasgow G33 5AF
| Today | See what it's worth now |
| 6 Mar 2026 | £260,000 |
No other historical records.
47, Jerviston Road, Glasgow G33 5QJ

| Today | See what it's worth now |
| 2 Mar 2026 | £85,275 |
| 31 Jan 2005 | £63,000 |
No other historical records.
32, Kincardine Square, Glasgow G33 5BU
| Today | See what it's worth now |
| 5 Feb 2026 | £187,000 |
| 20 Jan 2020 | £132,000 |
No other historical records.
15, Guildford Street, Glasgow G33 5EX
| Today | See what it's worth now |
| 3 Feb 2026 | £218,000 |
| 18 May 2018 | £149,995 |
No other historical records.
1, Collessie Drive, Glasgow G33 5QD
| Today | See what it's worth now |
| 2 Feb 2026 | £105,000 |
No other historical records.
2, Barholm Avenue, Glasgow G33 5AA
| Today | See what it's worth now |
| 28 Jan 2026 | £203,500 |
No other historical records.
Flat 1/2, 178, Mossvale Road, Glasgow G33 5PR

| Today | See what it's worth now |
| 21 Jan 2026 | £75,000 |
| 19 Oct 2022 | £60,000 |
39, Darnaway Avenue, Glasgow G33 5HR
| Today | See what it's worth now |
| 21 Jan 2026 | £197,000 |
No other historical records.
Flat 2/1, 3, Coxton Place, Glasgow G33 5EW

| Today | See what it's worth now |
| 23 Dec 2025 | £65,000 |
| 28 Nov 2006 | £53,250 |
86, Tillycairn Drive, Glasgow G33 5AF
| Today | See what it's worth now |
| 22 Dec 2025 | £167,000 |
| 23 Nov 2021 | £144,250 |
30, Craigievar Street, Glasgow G33 5DL
| Today | See what it's worth now |
| 18 Dec 2025 | £247,000 |
| 19 May 2008 | £145,000 |
Source Acknowledgement: © Crown copyright. Scottish house price data is publicly available information produced by the Registers of Scotland. Material has been reproduced with the permission of the Keeper of the Registers of Scotland and contains data compiled by Registers of Scotland. For further information, please contact data@ros.gov.uk. Please note the dates shown here relate to the property's registered date not sold date.This material was last updated on 10 July 2026. It covers the period from 8 December 1987 to 30 April 2026 and contains property transactions which have been registered during that period.
Disclaimer: Rightmove.co.uk provides this Registers of Scotland data "as is". The burden for fitness of the data relies completely with the user and is provided for informational purposes only. No warranty, express or implied, is given relating to the accuracy of content of the Registers of Scotland data and Rightmove plc does not accept any liability for error or omission. If you have found an error with the data or need further information please contact data@ros.gov.uk
Permitted Use: The Registers of Scotland allows the reproduction of the data which it provides to Rightmove.co.uk free of charge in any format or medium only for research, private study or for internal circulation within an organisation. This is subject to it being reproduced accurately and not used in a misleading context. The material must be acknowledged as Crown Copyright. You are not allowed to use this information for commercial purposes, nor must you copy, distribute, sell or publish the data in any way. For any other use of this material, please apply to the Registers of Scotland for a licence. You can do this online at www.ros.gov.uk, by email at data@ros.gov.uk or by writing to Business Development, Registers of Scotland, Meadowbank House, 153 London Road, Edinburgh EH8 7AU.
Rightmove takes no liability for your use of, or reliance on, Rightmove's Instant Valuation due to the limitations of our tracking tool listed here. Use of this tool is taken entirely at your own risk. All rights reserved.