
House Prices in Cranford St Andrew
House prices in Cranford St Andrew have an overall average of £313,182 over the last year.
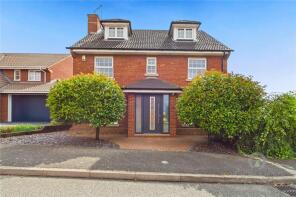
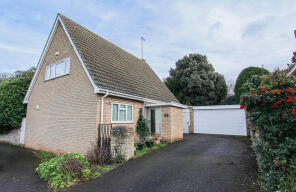
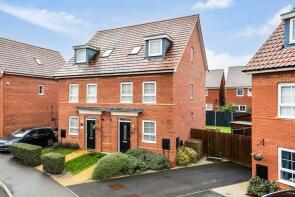
The majority of properties sold in Cranford St Andrew during the last year were detached properties, selling for an average price of £410,972. Semi-detached properties sold for an average of £274,078, with terraced properties fetching £213,930.
Overall, the historical sold prices in Cranford St Andrew over the last year were 1% down on the previous year and 6% down on the 2022 peak of £332,595.
Properties Sold
11, Scotney Way, Kettering NN14 4SA
| Today | See what it's worth now |
| 7 Apr 2026 | £510,000 |
| 25 Jan 2008 | £290,000 |
26, Sandpiper Road, Kettering NN14 4SH
| Today | See what it's worth now |
| 2 Apr 2026 | £140,000 |
| 10 Dec 2020 | £138,495 |
No other historical records.
1, Evergreen Drive, Kettering NN14 4AZ
| Today | See what it's worth now |
| 30 Mar 2026 | £415,000 |
| 4 Oct 2002 | £177,750 |
No other historical records.
12, Woodpecker Way, Kettering NN14 4RZ
| Today | See what it's worth now |
| 20 Mar 2026 | £297,500 |
| 27 Sep 2019 | £253,995 |
No other historical records.
Manor Farm Cottage, Ringstead Road, Denford NN14 4EL
| Today | See what it's worth now |
| 18 Mar 2026 | £490,000 |
No other historical records.
33, Hillcrest Close, Kettering NN14 4TB
| Today | See what it's worth now |
| 17 Mar 2026 | £275,000 |
| 18 Aug 2022 | £215,000 |
No other historical records.
4a, Church Street, Kettering NN14 4EX
| Today | See what it's worth now |
| 11 Mar 2026 | £950,000 |
| 7 Dec 2017 | £636,100 |
No other historical records.
82, Highfield Road, Kettering NN14 4NN

| Today | See what it's worth now |
| 10 Mar 2026 | £280,000 |
| 21 Dec 2006 | £149,995 |
No other historical records.
48, Nine Arches Way, Kettering NN14 4FD
| Today | See what it's worth now |
| 27 Feb 2026 | £575,000 |
| 29 Sep 2008 | £340,000 |
No other historical records.
5, Ash Court, Kettering NN14 4LP
| Today | See what it's worth now |
| 27 Feb 2026 | £380,000 |
| 6 Mar 2019 | £278,000 |
62, Station Road, Kettering NN14 4RW
| Today | See what it's worth now |
| 27 Feb 2026 | £290,000 |
| 15 Nov 2019 | £265,000 |
40, High Street, Kettering NN14 4DA
| Today | See what it's worth now |
| 27 Feb 2026 | £165,000 |
| 20 Sep 2002 | £60,000 |
No other historical records.
19, Charles Street, Kettering NN14 4NU
| Today | See what it's worth now |
| 27 Feb 2026 | £135,000 |
| 11 Dec 2020 | £111,250 |
No other historical records.
2, Kinewell Close, Kettering NN14 4TW

| Today | See what it's worth now |
| 26 Feb 2026 | £355,000 |
| 27 Oct 2000 | £108,000 |
32, Newell Road, Kettering NN14 4EP
| Today | See what it's worth now |
| 26 Feb 2026 | £275,000 |
| 21 Jan 2011 | £160,000 |
No other historical records.
35, Clare Drive, Kettering NN14 4TA
| Today | See what it's worth now |
| 26 Feb 2026 | £325,000 |
| 23 Aug 2007 | £229,950 |
Fairhaven Cottage, Lower Street, Great Addington NN14 4BL
| Today | See what it's worth now |
| 26 Feb 2026 | £520,000 |
| 24 Sep 2010 | £305,000 |
No other historical records.
15, Warwick Gardens, Kettering NN14 4XB
| Today | See what it's worth now |
| 26 Feb 2026 | £315,000 |
| 17 Oct 2014 | £193,500 |
24, Starling Way, Kettering NN14 4GE
| Today | See what it's worth now |
| 25 Feb 2026 | £250,000 |
| 25 Jun 2021 | £232,495 |
No other historical records.
10, Chancery Lane, Thrapston NN14 4JL
| Today | See what it's worth now |
| 20 Feb 2026 | £530,000 |
No other historical records.
38, Chancery Lane, Thrapston NN14 4JL
| Today | See what it's worth now |
| 18 Feb 2026 | £311,000 |
No other historical records.
5, Harrisons Walk, Kettering NN14 4GY
| Today | See what it's worth now |
| 12 Feb 2026 | £212,500 |
| 20 Aug 2018 | £195,000 |
2, Bonsor Gardens, Kettering NN14 4QW
| Today | See what it's worth now |
| 12 Feb 2026 | £440,000 |
| 8 Aug 2007 | £269,950 |
Source Acknowledgement: © Crown copyright. England and Wales house price data is publicly available information produced by the HM Land Registry.This material was last updated on 9 July 2026. It covers the period from 1 January 1995 to 30 April 2026 and contains property transactions which have been registered during that period. Contains HM Land Registry data © Crown copyright and database right 2026. This data is licensed under the Open Government Licence v3.0.
Disclaimer: Rightmove.co.uk provides this HM Land Registry data "as is". The burden for fitness of the data relies completely with the user and is provided for informational purposes only. No warranty, express or implied, is given relating to the accuracy of content of the HM Land Registry data and Rightmove does not accept any liability for error or omission. If you have found an error with the data or need further information please contact HM Land Registry.
Permitted Use: Viewers of this Information are granted permission to access this Crown copyright material and to download it onto electronic, magnetic, optical or similar storage media provided that such activities are for private research, study or in-house use only. Any other use of the material requires the formal written permission of Land Registry which can be requested from us, and is subject to an additional licence and associated charge.
Rightmove takes no liability for your use of, or reliance on, Rightmove's Instant Valuation due to the limitations of our tracking tool listed here. Use of this tool is taken entirely at your own risk. All rights reserved.