
House Prices in Cranshaws
House prices in Cranshaws have an overall average of £255,546 over the last year.
The majority of properties sold in Cranshaws during the last year were detached properties, selling for an average price of £400,017. Terraced properties sold for an average of £172,174, with semi-detached properties fetching £182,605.
Overall, the historical sold prices in Cranshaws over the last year were 6% up on the previous year and 5% up on the 2022 peak of £243,348.
Properties Sold
19, Windram Road, Chirnside TD11 3UT
| Today | See what it's worth now |
| 29 Apr 2026 | £140,000 |
No other historical records.
Dunroamin, Wellnage Myre, Duns TD11 3FP
| Today | See what it's worth now |
| 29 Apr 2026 | £475,000 |
No other historical records.
10, Whitehall Close, Chirnside TD11 3SS
| Today | See what it's worth now |
| 20 Apr 2026 | £177,000 |
| 17 Dec 2024 | £176,000 |
No other historical records.
Rooms 2 And 4, 25, Market Square, Duns TD11 3BY

| Today | See what it's worth now |
| 17 Apr 2026 | £105,000 |
| 30 Jun 2021 | £347,000 |
No other historical records.
21b Top Floor, South Street, Duns TD11 3AJ
| Today | See what it's worth now |
| 17 Apr 2026 | £120,000 |
| 3 Aug 2015 | £77,000 |
No other historical records.
6, Golden Square, Duns TD11 3AW

| Today | See what it's worth now |
| 17 Apr 2026 | £155,000 |
| 24 Apr 2025 | £160,000 |
First Floor, South Street, Duns TD11 3AJ
| Today | See what it's worth now |
| 17 Apr 2026 | £80,000 |
No other historical records.
Brewery House, Kirkgate, Duns TD11 3XL
| Today | See what it's worth now |
| 14 Apr 2026 | £602,500 |
| 9 Apr 2007 | £380,000 |
8, Whitehall Road, Duns TD11 3UB

| Today | See what it's worth now |
| 13 Apr 2026 | £270,000 |
| 10 Oct 2017 | £170,000 |
No other historical records.
14, Cumledge Mill, Duns TD11 3TF
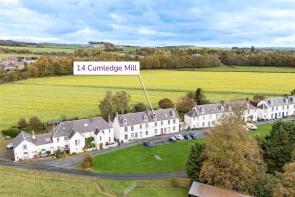
| Today | See what it's worth now |
| 30 Mar 2026 | £125,000 |
| 29 Jul 2024 | £75,000 |
15, Erskine Road, Duns TD11 3YB
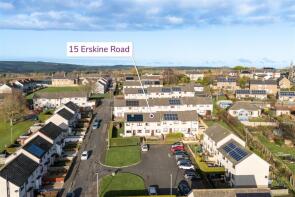
| Today | See what it's worth now |
| 27 Mar 2026 | £118,000 |
| 21 Apr 2009 | £38,000 |
No other historical records.
Elm Bank, Main Street West End, Chirnside TD11 3UJ
| Today | See what it's worth now |
| 26 Mar 2026 | £353,000 |
No other historical records.
53, Trinity Park, Duns TD11 3HN
| Today | See what it's worth now |
| 24 Mar 2026 | £197,500 |
| 30 Aug 2021 | £160,000 |
No other historical records.
12, U56-6 B6460 At Sinclairshill To Sinclairshill Housing, Duns TD11 3LU
| Today | See what it's worth now |
| 23 Mar 2026 | £220,000 |
| 24 Feb 2020 | £88,500 |
No other historical records.
6, Whitsomehill Farm Cottages, Duns TD11 3NF
| Today | See what it's worth now |
| 12 Mar 2026 | £162,500 |
| 11 Jul 2017 | £113,000 |
Cairnview Cottage, Main Street East End, Duns TD11 3XS
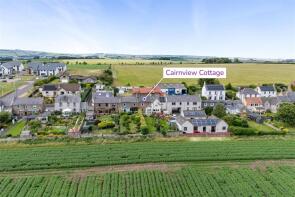
| Today | See what it's worth now |
| 10 Mar 2026 | £140,000 |
| 17 Jun 2021 | £131,125 |
No other historical records.
11, Station Avenue, Duns TD11 3HW
| Today | See what it's worth now |
| 10 Mar 2026 | £205,000 |
| 29 Jun 2017 | £132,000 |
School House, Gifford Road, Longformacus TD11 3NZ
| Today | See what it's worth now |
| 6 Mar 2026 | £225,000 |
No other historical records.
3a, Trinity Park, Duns TD11 3HN

| Today | See what it's worth now |
| 6 Mar 2026 | £285,000 |
| 28 Jan 2022 | £230,000 |
62, Hawthorn Bank, Duns TD11 3HL
| Today | See what it's worth now |
| 3 Mar 2026 | £145,000 |
| 30 Jan 2013 | £80,000 |
No other historical records.
Kirkhill Kirkgate, Kirkgate, Duns TD11 3XL
| Today | See what it's worth now |
| 2 Mar 2026 | £348,000 |
| 26 Nov 2020 | £280,000 |
48, Easter Street, Duns TD11 3DN
| Today | See what it's worth now |
| 24 Feb 2026 | £200,000 |
No other historical records.
Whitsome Lea, C99 C100 At Ravelaw To B6437 West Of Whitsome, Duns TD11 3NG
| Today | See what it's worth now |
| 18 Feb 2026 | £520,000 |
| 2 Oct 2012 | £300,000 |
No other historical records.
Source Acknowledgement: © Crown copyright. Scottish house price data is publicly available information produced by the Registers of Scotland. Material has been reproduced with the permission of the Keeper of the Registers of Scotland and contains data compiled by Registers of Scotland. For further information, please contact data@ros.gov.uk. Please note the dates shown here relate to the property's registered date not sold date.This material was last updated on 10 July 2026. It covers the period from 8 December 1987 to 30 April 2026 and contains property transactions which have been registered during that period.
Disclaimer: Rightmove.co.uk provides this Registers of Scotland data "as is". The burden for fitness of the data relies completely with the user and is provided for informational purposes only. No warranty, express or implied, is given relating to the accuracy of content of the Registers of Scotland data and Rightmove plc does not accept any liability for error or omission. If you have found an error with the data or need further information please contact data@ros.gov.uk
Permitted Use: The Registers of Scotland allows the reproduction of the data which it provides to Rightmove.co.uk free of charge in any format or medium only for research, private study or for internal circulation within an organisation. This is subject to it being reproduced accurately and not used in a misleading context. The material must be acknowledged as Crown Copyright. You are not allowed to use this information for commercial purposes, nor must you copy, distribute, sell or publish the data in any way. For any other use of this material, please apply to the Registers of Scotland for a licence. You can do this online at www.ros.gov.uk, by email at data@ros.gov.uk or by writing to Business Development, Registers of Scotland, Meadowbank House, 153 London Road, Edinburgh EH8 7AU.
Rightmove takes no liability for your use of, or reliance on, Rightmove's Instant Valuation due to the limitations of our tracking tool listed here. Use of this tool is taken entirely at your own risk. All rights reserved.