
House Prices in Crawley Hill
House prices in Crawley Hill have an overall average of £503,026 over the last year.
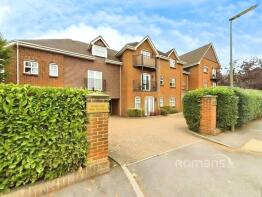
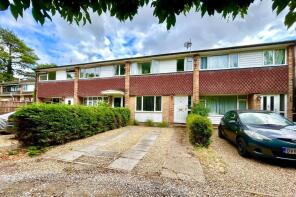
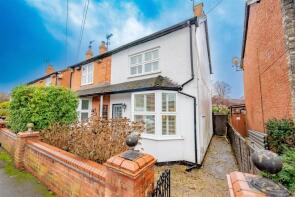
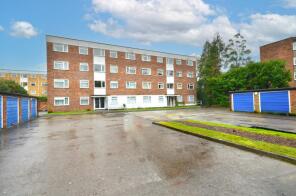
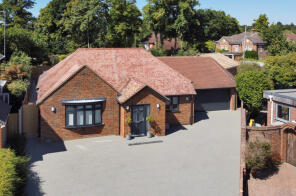
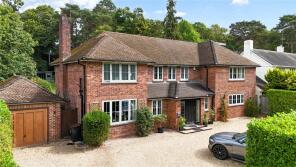
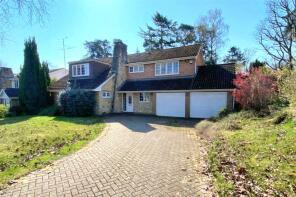
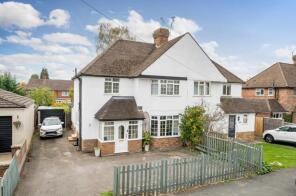
The majority of properties sold in Crawley Hill during the last year were flats, selling for an average price of £257,750. Detached properties sold for an average of £830,830, with semi-detached properties fetching £454,871.
Overall, the historical sold prices in Crawley Hill over the last year were 10% down on the previous year and 5% down on the 2023 peak of £529,429.
Properties Sold
Flat 3, Number One, Upper Park Road, Camberley GU15 2ET
| Today | See what it's worth now |
| 27 Apr 2026 | £237,000 |
| 29 Jul 2005 | £200,000 |
13, The Grove, Frimley, Camberley GU16 8PL
| Today | See what it's worth now |
| 20 Apr 2026 | £350,000 |
| 25 Oct 2013 | £241,000 |
46, Watchetts Road, Camberley GU15 2PB
| Today | See what it's worth now |
| 17 Apr 2026 | £437,000 |
| 22 Mar 2007 | £248,000 |
Flat 11, Falcon Court, The Cloisters, Frimley, Camberley GU16 7JW
| Today | See what it's worth now |
| 15 Apr 2026 | £215,000 |
| 13 Jan 2006 | £155,950 |
No other historical records.
3, Lendore Road, Frimley, Camberley GU16 7EJ
| Today | See what it's worth now |
| 7 Apr 2026 | £525,000 |
| 12 Oct 2023 | £493,300 |
Flat 11, 7 Queens Keep, Upper Park Road, Camberley GU15 2ET
| Today | See what it's worth now |
| 27 Mar 2026 | £253,500 |
| 22 Jan 2025 | £120,000 |
14, Copse End, Camberley GU15 2BP
| Today | See what it's worth now |
| 27 Mar 2026 | £870,000 |
| 17 Feb 2012 | £585,000 |
Flat 1, 87 Roxborough House, Middle Gordon Road, Camberley GU15 2JA
| Today | See what it's worth now |
| 27 Mar 2026 | £400,000 |
| 28 Jan 2019 | £415,000 |
No other historical records.
7, Watchetts Lake Close, Camberley GU15 2PG
| Today | See what it's worth now |
| 26 Mar 2026 | £910,000 |
No other historical records.
9 Starswood, Kingsley Avenue, Camberley GU15 2NA
| Today | See what it's worth now |
| 25 Mar 2026 | £1,450,000 |
| 26 Jun 2017 | £990,000 |
10, The Close, Frimley, Camberley GU16 7HQ
| Today | See what it's worth now |
| 23 Mar 2026 | £500,000 |
| 27 Nov 2008 | £250,000 |
No other historical records.
12, Chancellor Drive, Frimley, Camberley GU16 7AN

| Today | See what it's worth now |
| 20 Mar 2026 | £466,500 |
| 13 Dec 2016 | £470,000 |
No other historical records.
Flat 17, 25 Wyvern House, Maybury Close, Frimley, Camberley GU16 7AX
| Today | See what it's worth now |
| 16 Mar 2026 | £192,000 |
| 13 Mar 2020 | £245,000 |
No other historical records.
191, Gordon Avenue, Camberley GU15 2NY

| Today | See what it's worth now |
| 13 Mar 2026 | £580,000 |
| 1 Jun 2018 | £446,500 |
4, Alsace Walk, Camberley GU15 2SJ
| Today | See what it's worth now |
| 12 Mar 2026 | £370,000 |
| 16 Oct 2015 | £274,950 |
Flat 29, 25 Wyvern House, Maybury Close, Frimley, Camberley GU16 7AX

| Today | See what it's worth now |
| 9 Mar 2026 | £165,000 |
| 6 Feb 2020 | £215,000 |
No other historical records.
16, Watchetts Road, Camberley GU15 2PB
| Today | See what it's worth now |
| 6 Mar 2026 | £340,000 |
| 9 Mar 2001 | £120,000 |
No other historical records.
19, Trafford Road, Frimley, Camberley GU16 7EE
| Today | See what it's worth now |
| 6 Mar 2026 | £470,000 |
No other historical records.
4, Park Road, Camberley GU15 2SR
| Today | See what it's worth now |
| 4 Mar 2026 | £225,000 |
| 22 Oct 2004 | £195,500 |
No other historical records.
5, Copse Close, Camberley GU15 2BW
| Today | See what it's worth now |
| 26 Feb 2026 | £780,000 |
| 4 Jan 2007 | £499,999 |
No other historical records.
Flat 2, Sentry House, Frimley Road, Camberley GU15 2QN
| Today | See what it's worth now |
| 24 Feb 2026 | £135,000 |
| 17 Jan 2020 | £160,000 |
No other historical records.
28, Field Lane, Frimley, Camberley GU16 8JU
| Today | See what it's worth now |
| 20 Feb 2026 | £545,000 |
| 17 Sep 2009 | £365,000 |
No other historical records.
7, James Road, Camberley GU15 2RG
| Today | See what it's worth now |
| 19 Feb 2026 | £510,000 |
| 21 Jun 1996 | £87,000 |
No other historical records.

Source Acknowledgement: © Crown copyright. England and Wales house price data is publicly available information produced by the HM Land Registry.This material was last updated on 9 July 2026. It covers the period from 1 January 1995 to 30 April 2026 and contains property transactions which have been registered during that period. Contains HM Land Registry data © Crown copyright and database right 2026. This data is licensed under the Open Government Licence v3.0.
Disclaimer: Rightmove.co.uk provides this HM Land Registry data "as is". The burden for fitness of the data relies completely with the user and is provided for informational purposes only. No warranty, express or implied, is given relating to the accuracy of content of the HM Land Registry data and Rightmove does not accept any liability for error or omission. If you have found an error with the data or need further information please contact HM Land Registry.
Permitted Use: Viewers of this Information are granted permission to access this Crown copyright material and to download it onto electronic, magnetic, optical or similar storage media provided that such activities are for private research, study or in-house use only. Any other use of the material requires the formal written permission of Land Registry which can be requested from us, and is subject to an additional licence and associated charge.
Rightmove takes no liability for your use of, or reliance on, Rightmove's Instant Valuation due to the limitations of our tracking tool listed here. Use of this tool is taken entirely at your own risk. All rights reserved.