
House Prices in Crick
House prices in Crick have an overall average of £445,028 over the last year.
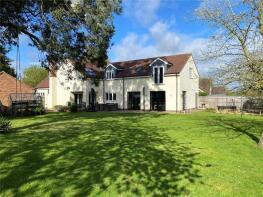
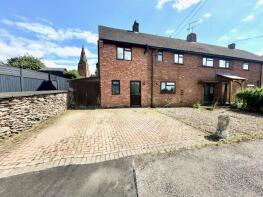
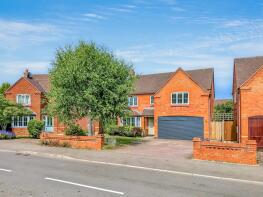
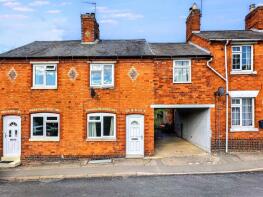
The majority of properties sold in Crick during the last year were detached properties, selling for an average price of £548,864. Semi-detached properties sold for an average of £281,857.
Overall, the historical sold prices in Crick over the last year were 13% up on the previous year and 4% up on the 2023 peak of £426,961.
Properties Sold
12, Pyke Way, Northampton NN6 7NZ
| Today | See what it's worth now |
| 12 Feb 2026 | £575,000 |
| 30 Sep 2002 | £244,000 |
No other historical records.
50, Watford Road, Northampton NN6 7TT
| Today | See what it's worth now |
| 30 Jan 2026 | £445,000 |
| 12 Apr 2000 | £120,000 |
No other historical records.
3 Dovedale, Oak Lane, Northampton NN6 7SS

| Today | See what it's worth now |
| 8 Dec 2025 | £415,000 |
| 29 Oct 2020 | £375,000 |
2 Pipers Croft, Oak Lane, Northampton NN6 7SS
| Today | See what it's worth now |
| 3 Dec 2025 | £500,000 |
| 5 Sep 1997 | £118,000 |
No other historical records.
2, Rectory Close, Northampton NN6 7SY
| Today | See what it's worth now |
| 27 Nov 2025 | £350,000 |
| 17 May 2023 | £307,000 |
30, Fallowfields, Northampton NN6 7GA
| Today | See what it's worth now |
| 14 Nov 2025 | £500,000 |
| 25 Aug 2016 | £359,995 |
No other historical records.
6, Drayson Lane, Northampton NN6 7SR
| Today | See what it's worth now |
| 13 Nov 2025 | £920,000 |
| 23 Dec 2015 | £675,000 |
5, Bucknills Lane, Northampton NN6 7SX
| Today | See what it's worth now |
| 7 Nov 2025 | £311,000 |
| 10 Oct 1997 | £50,000 |
No other historical records.
8, The High Leys, Northampton NN6 7TE
| Today | See what it's worth now |
| 30 Oct 2025 | £360,000 |
| 29 Jun 2001 | £113,000 |
No other historical records.
Ashby House, High Street, Northampton NN6 7TS

| Today | See what it's worth now |
| 30 Oct 2025 | £645,000 |
| 22 Nov 2011 | £440,000 |
40 Tumbledown Cottage, Main Road, Northampton NN6 7TX
| Today | See what it's worth now |
| 24 Oct 2025 | £350,000 |
| 27 Nov 2001 | £47,500 |
52, Cowley Meadow Way, Northampton NN6 7TY
| Today | See what it's worth now |
| 10 Oct 2025 | £440,000 |
| 7 Dec 2022 | £420,000 |
16, Bury Dyke, Northampton NN6 7XA
| Today | See what it's worth now |
| 10 Oct 2025 | £492,500 |
| 2 Nov 2020 | £440,000 |
8, Yelvertoft Road, Northampton NN6 7TR
| Today | See what it's worth now |
| 6 Oct 2025 | £192,000 |
| 16 Jun 2000 | £73,000 |
36, Lauds Road, Northampton NN6 7TJ
| Today | See what it's worth now |
| 6 Oct 2025 | £275,000 |
| 21 Jul 2015 | £218,000 |
Waterside, West Haddon Road, Crick NN6 7SQ
| Today | See what it's worth now |
| 12 Sep 2025 | £745,000 |
No other historical records.
8, Howkins Road, Northampton NN6 7WP

| Today | See what it's worth now |
| 4 Sep 2025 | £275,000 |
| 30 Nov 2017 | £230,995 |
No other historical records.
43, King Style Close, Northampton NN6 7ST
| Today | See what it's worth now |
| 4 Sep 2025 | £220,000 |
| 22 Apr 2014 | £158,000 |
29, Watford Road, Crick NN6 7TT
| Today | See what it's worth now |
| 27 Jun 2025 | £401,000 |
No other historical records.
26, Boat Horse Lane, Northampton NN6 7TH
| Today | See what it's worth now |
| 27 Jun 2025 | £730,000 |
| 23 Aug 2004 | £320,000 |
No other historical records.
35, Lauds Road, Northampton NN6 7TJ
| Today | See what it's worth now |
| 30 May 2025 | £345,000 |
No other historical records.
5 Beehive Cottage, Lauds Road, Northampton NN6 7TJ
| Today | See what it's worth now |
| 29 May 2025 | £575,000 |
| 12 Jan 2007 | £395,000 |
12, Fallowfields, Northampton NN6 7GA
| Today | See what it's worth now |
| 3 Apr 2025 | £510,000 |
| 18 Jun 2021 | £475,000 |
Source Acknowledgement: © Crown copyright. England and Wales house price data is publicly available information produced by the HM Land Registry.This material was last updated on 9 July 2026. It covers the period from 1 January 1995 to 30 April 2026 and contains property transactions which have been registered during that period. Contains HM Land Registry data © Crown copyright and database right 2026. This data is licensed under the Open Government Licence v3.0.
Disclaimer: Rightmove.co.uk provides this HM Land Registry data "as is". The burden for fitness of the data relies completely with the user and is provided for informational purposes only. No warranty, express or implied, is given relating to the accuracy of content of the HM Land Registry data and Rightmove does not accept any liability for error or omission. If you have found an error with the data or need further information please contact HM Land Registry.
Permitted Use: Viewers of this Information are granted permission to access this Crown copyright material and to download it onto electronic, magnetic, optical or similar storage media provided that such activities are for private research, study or in-house use only. Any other use of the material requires the formal written permission of Land Registry which can be requested from us, and is subject to an additional licence and associated charge.
Rightmove takes no liability for your use of, or reliance on, Rightmove's Instant Valuation due to the limitations of our tracking tool listed here. Use of this tool is taken entirely at your own risk. All rights reserved.