
House Prices in Cromer
House prices in Cromer have an overall average of £296,559 over the last year.
The majority of properties sold in Cromer during the last year were flats, selling for an average price of £194,055. Detached properties sold for an average of £421,364, with terraced properties fetching £278,260.
Overall, the historical sold prices in Cromer over the last year were 2% up on the previous year and similar to the 2023 peak of £298,449.
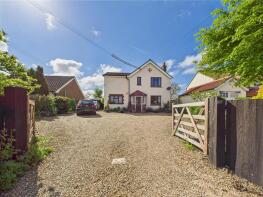
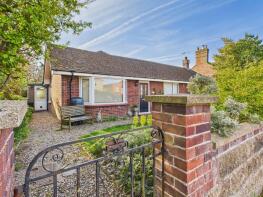
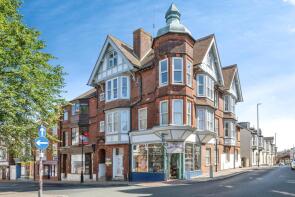
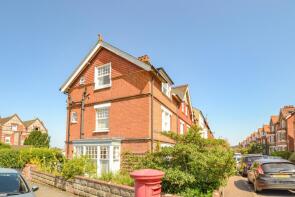
Properties Sold
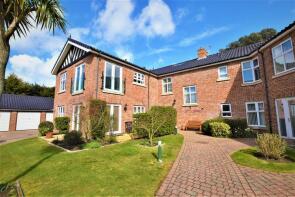
4, 5 Anglia Court, Runton Road, Cromer NR27 9AR
| Today | See what it's worth now |
| 29 Apr 2026 | £420,000 |
| 29 Nov 2013 | £270,000 |
No other historical records.
68, Central Road, Cromer NR27 9BW
| Today | See what it's worth now |
| 17 Apr 2026 | £240,000 |
| 7 Aug 2015 | £179,950 |
3, Jubilee Terrace, Jubilee Lane, Cromer NR27 0EW
| Today | See what it's worth now |
| 15 Apr 2026 | £217,000 |
| 25 Nov 2016 | £168,000 |
17, Albany Court, Beach Road, Cromer NR27 9AZ
| Today | See what it's worth now |
| 13 Apr 2026 | £230,000 |
| 12 Oct 2021 | £240,000 |
240, Roughton Road, Cromer NR27 9LQ
| Today | See what it's worth now |
| 2 Apr 2026 | £420,000 |
| 17 Sep 2001 | £134,950 |
13 Hillside, Cliff Road, Cromer NR27 0BU
| Today | See what it's worth now |
| 31 Mar 2026 | £415,000 |
| 14 Jul 2017 | £290,000 |
No other historical records.
6, 13 Haverhill House, Bond Street, Cromer NR27 9DA
| Today | See what it's worth now |
| 27 Mar 2026 | £125,000 |
| 27 Oct 2023 | £120,000 |
48, St Marys Road, Cromer NR27 9DJ
| Today | See what it's worth now |
| 24 Mar 2026 | £442,000 |
| 4 Nov 2022 | £455,000 |
31, Christophers Close, Cromer NR27 0GA
| Today | See what it's worth now |
| 20 Mar 2026 | £342,500 |
| 17 Mar 2021 | £310,000 |
143, Mill Road, Cromer NR27 0BH
| Today | See what it's worth now |
| 20 Mar 2026 | £253,000 |
| 11 Oct 2013 | £118,555 |
No other historical records.
39, Clifton Park, Cromer NR27 9BG
| Today | See what it's worth now |
| 19 Mar 2026 | £425,000 |
No other historical records.
Calday Grange, Mill Road, Cromer NR27 0BG
| Today | See what it's worth now |
| 16 Mar 2026 | £390,000 |
| 20 Mar 1998 | £69,950 |
No other historical records.
1, Bittern Rise, Cromer NR27 9GU
| Today | See what it's worth now |
| 13 Mar 2026 | £510,000 |
| 16 Aug 2013 | £227,500 |
18, St Martins Close, Cromer NR27 0BN
| Today | See what it's worth now |
| 4 Mar 2026 | £360,000 |
| 10 Mar 2023 | £300,000 |
No other historical records.
41, Ashdown Court, Cromer NR27 0AE
| Today | See what it's worth now |
| 27 Feb 2026 | £139,000 |
| 3 Dec 2004 | £130,000 |
49, Randall Crescent, Cromer NR27 0FD
| Today | See what it's worth now |
| 27 Feb 2026 | £305,000 |
No other historical records.
Flat 10, Suffield Court, Mill Road, Cromer NR27 0BH
| Today | See what it's worth now |
| 20 Feb 2026 | £165,000 |
| 29 Jan 2016 | £109,000 |
3, Bridge Close, Cromer NR27 0FJ
| Today | See what it's worth now |
| 20 Feb 2026 | £265,000 |
No other historical records.
1b, Swinton House, Old Coach Road, Cromer NR27 0PZ
| Today | See what it's worth now |
| 20 Feb 2026 | £253,000 |
| 17 Sep 2010 | £205,000 |
8, Henry Blogg Road, Cromer NR27 0JG
| Today | See what it's worth now |
| 20 Feb 2026 | £287,000 |
| 16 Jan 2009 | £173,000 |
14, Wyndham Park, Cromer NR27 9NJ
| Today | See what it's worth now |
| 18 Feb 2026 | £270,000 |
| 13 Jun 2013 | £124,500 |
26, Ashdown Court, Cromer NR27 0AE
| Today | See what it's worth now |
| 17 Feb 2026 | £167,500 |
| 11 Sep 2015 | £135,000 |
30 Treetops, Westcliff Avenue, Cromer NR27 9BA
| Today | See what it's worth now |
| 13 Feb 2026 | £245,000 |
| 14 Jan 2016 | £163,750 |

Source Acknowledgement: © Crown copyright. England and Wales house price data is publicly available information produced by the HM Land Registry.This material was last updated on 9 July 2026. It covers the period from 1 January 1995 to 30 April 2026 and contains property transactions which have been registered during that period. Contains HM Land Registry data © Crown copyright and database right 2026. This data is licensed under the Open Government Licence v3.0.
Disclaimer: Rightmove.co.uk provides this HM Land Registry data "as is". The burden for fitness of the data relies completely with the user and is provided for informational purposes only. No warranty, express or implied, is given relating to the accuracy of content of the HM Land Registry data and Rightmove does not accept any liability for error or omission. If you have found an error with the data or need further information please contact HM Land Registry.
Permitted Use: Viewers of this Information are granted permission to access this Crown copyright material and to download it onto electronic, magnetic, optical or similar storage media provided that such activities are for private research, study or in-house use only. Any other use of the material requires the formal written permission of Land Registry which can be requested from us, and is subject to an additional licence and associated charge.
Rightmove takes no liability for your use of, or reliance on, Rightmove's Instant Valuation due to the limitations of our tracking tool listed here. Use of this tool is taken entirely at your own risk. All rights reserved.