
House Prices in Crook Log
House prices in Crook Log have an overall average of £469,488 over the last year.
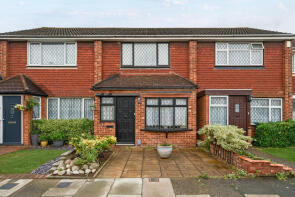
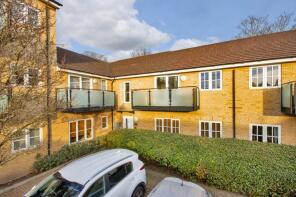
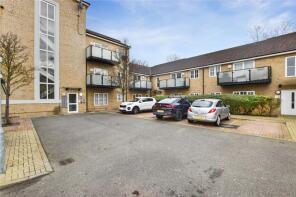
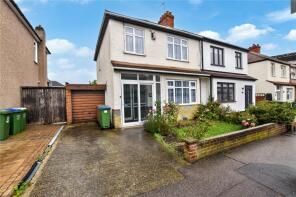
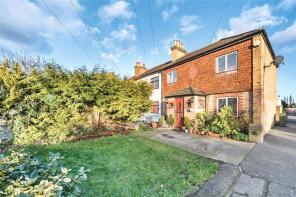
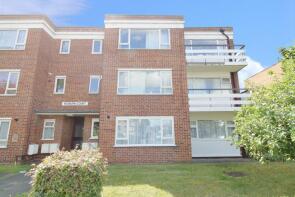
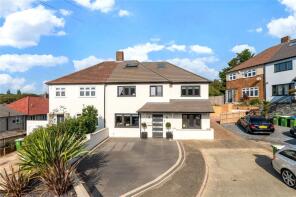
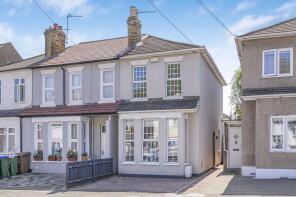
The majority of properties sold in Crook Log during the last year were semi-detached properties, selling for an average price of £533,562. Terraced properties sold for an average of £437,727, with flats fetching £271,600.
Overall, the historical sold prices in Crook Log over the last year were 1% down on the previous year and 7% down on the 2022 peak of £505,813.
Properties Sold
77, Upton Road, Bexleyheath DA6 8LN
| Today | See what it's worth now |
| 2 Apr 2026 | £535,000 |
| 9 Jan 1998 | £95,000 |
No other historical records.
33, Standard Road, Bexleyheath DA6 8DP

| Today | See what it's worth now |
| 31 Mar 2026 | £408,500 |
No other historical records.
16, Askern Close, Bexleyheath DA6 8JE

| Today | See what it's worth now |
| 26 Mar 2026 | £560,000 |
| 5 Aug 2022 | £536,000 |
No other historical records.
31, Olron Crescent, Bexleyheath DA6 8JY
| Today | See what it's worth now |
| 13 Mar 2026 | £585,000 |
No other historical records.
53, Bean Road, Bexleyheath DA6 8HW
| Today | See what it's worth now |
| 9 Mar 2026 | £840,000 |
| 22 Feb 2017 | £685,000 |
23, Talehangers Close, Bexleyheath DA6 8AE
| Today | See what it's worth now |
| 25 Feb 2026 | £255,000 |
| 8 Aug 2014 | £230,000 |
29, Sunland Avenue, Bexleyheath DA6 8LP
| Today | See what it's worth now |
| 18 Feb 2026 | £405,000 |
| 1 Apr 2022 | £375,000 |
11, Windsor Road, Bexleyheath DA6 8JH
| Today | See what it's worth now |
| 30 Jan 2026 | £500,000 |
No other historical records.
41a, Upton Road, Bexleyheath DA6 8LW
| Today | See what it's worth now |
| 29 Jan 2026 | £1,160,000 |
| 18 Dec 2009 | £350,000 |
No other historical records.
21, Green Vale, Bexleyheath DA6 8JT
| Today | See what it's worth now |
| 23 Jan 2026 | £265,000 |
| 25 Sep 2013 | £168,500 |
30, Iverhurst Close, Bexleyheath DA6 8HY
| Today | See what it's worth now |
| 23 Jan 2026 | £367,000 |
| 11 Apr 2001 | £125,000 |
3, Brunswick Road, Bexleyheath DA6 8EL
| Today | See what it's worth now |
| 15 Jan 2026 | £457,000 |
| 27 Jul 2022 | £450,000 |
No other historical records.
32, Talehangers Close, Bexleyheath DA6 8AE
| Today | See what it's worth now |
| 7 Jan 2026 | £280,000 |
| 10 Apr 2019 | £257,000 |
30, Talehangers Close, Bexleyheath DA6 8AE
| Today | See what it's worth now |
| 19 Dec 2025 | £280,000 |
| 7 Aug 2017 | £290,000 |
52, Dallin Road, Bexleyheath DA6 8EJ
| Today | See what it's worth now |
| 19 Dec 2025 | £535,000 |
No other historical records.
1, 3 Woburn Court, Crook Log, Bexleyheath DA6 8DZ

| Today | See what it's worth now |
| 18 Dec 2025 | £153,000 |
| 26 May 2000 | £75,000 |
No other historical records.
14a, Barton Close, Bexleyheath DA6 8JP
| Today | See what it's worth now |
| 5 Dec 2025 | £328,000 |
| 13 Dec 2016 | £265,000 |
117, Lion Road, Bexleyheath DA6 8PG
| Today | See what it's worth now |
| 5 Dec 2025 | £500,000 |
| 28 Mar 2018 | £430,000 |
8, Grosvenor Road, Bexleyheath DA6 8JU
| Today | See what it's worth now |
| 17 Nov 2025 | £425,000 |
| 18 Jul 2013 | £235,500 |
28, Grosvenor Road, Bexleyheath DA6 8JU
| Today | See what it's worth now |
| 17 Nov 2025 | £565,000 |
| 6 Sep 2001 | £173,000 |
No other historical records.
93, Alers Road, Bexleyheath DA6 8HT
| Today | See what it's worth now |
| 6 Nov 2025 | £415,000 |
| 19 Apr 2001 | £148,000 |
No other historical records.
2, 3 Woburn Court, Crook Log, Bexleyheath DA6 8DZ
| Today | See what it's worth now |
| 31 Oct 2025 | £230,000 |
| 6 Nov 2023 | £250,000 |
30, Brasted Close, Bexleyheath DA6 8HX
| Today | See what it's worth now |
| 24 Oct 2025 | £765,000 |
| 16 Mar 2018 | £360,000 |
No other historical records.
Source Acknowledgement: © Crown copyright. England and Wales house price data is publicly available information produced by the HM Land Registry.This material was last updated on 9 July 2026. It covers the period from 1 January 1995 to 30 April 2026 and contains property transactions which have been registered during that period. Contains HM Land Registry data © Crown copyright and database right 2026. This data is licensed under the Open Government Licence v3.0.
Disclaimer: Rightmove.co.uk provides this HM Land Registry data "as is". The burden for fitness of the data relies completely with the user and is provided for informational purposes only. No warranty, express or implied, is given relating to the accuracy of content of the HM Land Registry data and Rightmove does not accept any liability for error or omission. If you have found an error with the data or need further information please contact HM Land Registry.
Permitted Use: Viewers of this Information are granted permission to access this Crown copyright material and to download it onto electronic, magnetic, optical or similar storage media provided that such activities are for private research, study or in-house use only. Any other use of the material requires the formal written permission of Land Registry which can be requested from us, and is subject to an additional licence and associated charge.
Rightmove takes no liability for your use of, or reliance on, Rightmove's Instant Valuation due to the limitations of our tracking tool listed here. Use of this tool is taken entirely at your own risk. All rights reserved.