
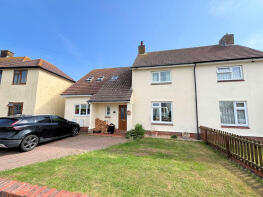
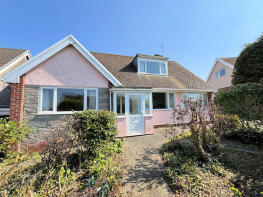
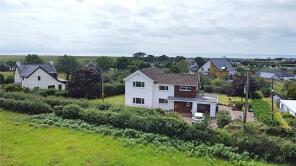
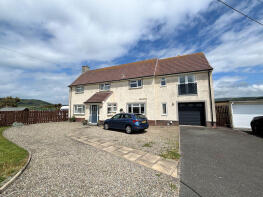
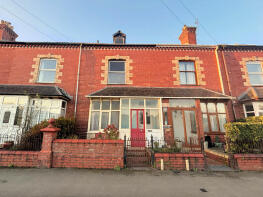
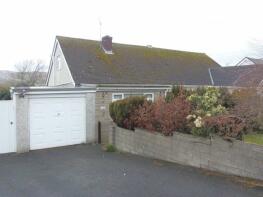
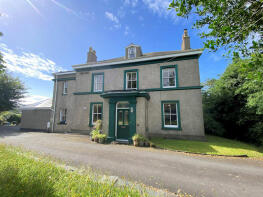
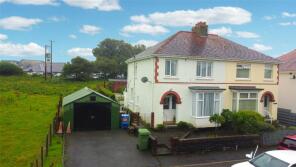
House Prices in Crynllwyn
House prices in Crynllwyn have an overall average of £245,017 over the last year.
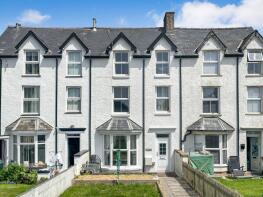
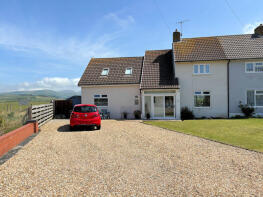
The majority of properties sold in Crynllwyn during the last year were detached properties, selling for an average price of £345,909. Terraced properties sold for an average of £171,636, with semi-detached properties fetching £207,188.
Overall, the historical sold prices in Crynllwyn over the last year were 19% up on the previous year and 10% up on the 2022 peak of £222,004.
Properties Sold
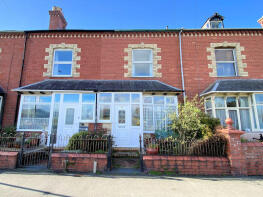
59, Sandilands Road, Tywyn LL36 9AT
| Today | See what it's worth now |
| 7 Apr 2026 | £215,000 |
| 20 Oct 2023 | £236,500 |
32, Ffordd Dyfrig, Tywyn LL36 9EH
| Today | See what it's worth now |
| 1 Apr 2026 | £248,000 |
| 3 Dec 1998 | £68,000 |
No other historical records.
Erw Deg, Tywyn LL36 9HN
| Today | See what it's worth now |
| 31 Mar 2026 | £390,000 |
| 4 Oct 2012 | £270,000 |
No other historical records.
11, Morfa Crescent, Tywyn LL36 9AU
| Today | See what it's worth now |
| 20 Mar 2026 | £390,000 |
| 15 Jan 2014 | £249,995 |
14 Meirionfa, National Street, Tywyn LL36 9DB
| Today | See what it's worth now |
| 13 Mar 2026 | £150,000 |
| 16 Dec 2020 | £90,000 |
Bridge Cottage, Road From Islwyn Northeastwards Passing Hall To Pump House, Tywyn LL36 9TY
| Today | See what it's worth now |
| 10 Mar 2026 | £140,000 |
| 16 Feb 2001 | £49,000 |
No other historical records.
Capel Peniel, Road From Islwyn Northeastwards Passing Hall To Pump House, Tywyn LL36 9TY
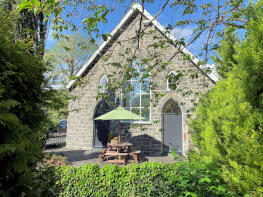
| Today | See what it's worth now |
| 3 Mar 2026 | £225,000 |
| 25 Aug 2017 | £230,000 |
No other historical records.
12 Dolgau, Cleveland Avenue, Tywyn LL36 9EG
| Today | See what it's worth now |
| 23 Feb 2026 | £215,000 |
| 4 Mar 2019 | £168,000 |
32 Dolwar, Idris Villas, Tywyn LL36 9AW
| Today | See what it's worth now |
| 3 Feb 2026 | £175,000 |
| 13 Feb 2006 | £122,000 |
Glan Y Mãrfa, Bryncrug LL36 9RF
| Today | See what it's worth now |
| 28 Jan 2026 | £570,000 |
No other historical records.
16 Swn Y Mor, Station Road, Tywyn LL36 9AH
| Today | See what it's worth now |
| 20 Jan 2026 | £178,000 |
| 22 Jan 2021 | £169,000 |
53, Sandilands Road, Tywyn LL36 9AT
| Today | See what it's worth now |
| 7 Jan 2026 | £273,000 |
No other historical records.
4 Carreg Las, Water Street, Tywyn LL36 9YB
| Today | See what it's worth now |
| 15 Dec 2025 | £165,000 |
| 8 Mar 2024 | £175,000 |
8 Penfro, Bron Y Gader, Tywyn LL36 9YH

| Today | See what it's worth now |
| 28 Nov 2025 | £130,000 |
| 13 Jun 2024 | £142,500 |
31 Cefn Y Wern, High Street, Tywyn LL36 9AE

| Today | See what it's worth now |
| 19 Nov 2025 | £238,000 |
| 7 Jul 2020 | £90,000 |
No other historical records.
33, Idris Villas, Tywyn LL36 9AW
| Today | See what it's worth now |
| 19 Nov 2025 | £112,000 |
No other historical records.
21, Ffordd Dyfrig, Tywyn LL36 9EH
| Today | See what it's worth now |
| 10 Nov 2025 | £235,000 |
| 21 Aug 2015 | £150,000 |
Ael Y Bryn, Brynhyfryd Road, Tywyn LL36 9HG
| Today | See what it's worth now |
| 31 Oct 2025 | £585,000 |
| 8 Dec 2016 | £425,000 |
65, Sandilands Road, Tywyn LL36 9AT
| Today | See what it's worth now |
| 31 Oct 2025 | £235,000 |
| 26 Nov 2021 | £164,000 |
No other historical records.
9, Cleveland Avenue, Tywyn LL36 9EG
| Today | See what it's worth now |
| 31 Oct 2025 | £170,000 |
No other historical records.
Clydfan, Road From Islwyn To Maesegryn, Tywyn LL36 9SN
| Today | See what it's worth now |
| 29 Aug 2025 | £180,000 |
| 26 Nov 2014 | £135,000 |
Bod Talog Bungalow, Tywyn LL36 9HS
| Today | See what it's worth now |
| 28 Aug 2025 | £410,000 |
| 11 Jul 2014 | £215,000 |
Golwg Y Mãr, Brynhyfryd Road, Tywyn LL36 9HG
| Today | See what it's worth now |
| 26 Aug 2025 | £277,000 |
No other historical records.

Source Acknowledgement: © Crown copyright. England and Wales house price data is publicly available information produced by the HM Land Registry.This material was last updated on 9 July 2026. It covers the period from 1 January 1995 to 30 April 2026 and contains property transactions which have been registered during that period. Contains HM Land Registry data © Crown copyright and database right 2026. This data is licensed under the Open Government Licence v3.0.
Disclaimer: Rightmove.co.uk provides this HM Land Registry data "as is". The burden for fitness of the data relies completely with the user and is provided for informational purposes only. No warranty, express or implied, is given relating to the accuracy of content of the HM Land Registry data and Rightmove does not accept any liability for error or omission. If you have found an error with the data or need further information please contact HM Land Registry.
Permitted Use: Viewers of this Information are granted permission to access this Crown copyright material and to download it onto electronic, magnetic, optical or similar storage media provided that such activities are for private research, study or in-house use only. Any other use of the material requires the formal written permission of Land Registry which can be requested from us, and is subject to an additional licence and associated charge.
Rightmove takes no liability for your use of, or reliance on, Rightmove's Instant Valuation due to the limitations of our tracking tool listed here. Use of this tool is taken entirely at your own risk. All rights reserved.