
House Prices in Dymchurch Road, Hythe, Kent, CT21
House prices in Dymchurch Road have an overall average of £311,062 over the last year.
The majority of properties sold in Dymchurch Road during the last year were terraced properties, selling for an average price of £269,500. Semi-detached properties sold for an average of £315,167, with detached properties fetching £465,000.
Overall, the historical sold prices in Dymchurch Road over the last year were 15% up on the previous year and 3% down on the 2022 peak of £319,885.
Properties Sold
35, Princes Terrace, Dymchurch Road, Hythe CT21 6LY

| Today | See what it's worth now |
| 8 May 2025 | £261,000 |
| 15 Jan 2019 | £197,000 |
No other historical records.
38, Dymchurch Road, Hythe CT21 6JX

| Today | See what it's worth now |
| 28 Mar 2025 | £282,500 |
| 30 Aug 2002 | £72,500 |
No other historical records.
49, Princes Terrace, Dymchurch Road, Hythe CT21 6LY

| Today | See what it's worth now |
| 22 Nov 2024 | £265,000 |
| 19 Aug 1996 | £35,850 |
No other historical records.
14, Princes Terrace, Dymchurch Road, Hythe CT21 6LX
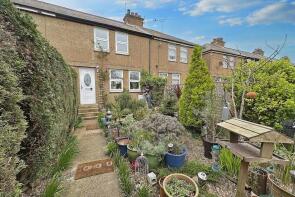
| Today | See what it's worth now |
| 25 Oct 2024 | £267,000 |
| 7 Sep 2018 | £230,000 |
74, Dymchurch Road, Hythe CT21 6JX
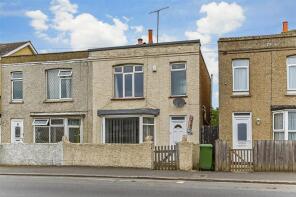
| Today | See what it's worth now |
| 21 Oct 2024 | £243,000 |
| 1 Mar 2022 | £228,000 |
14, Palmarsh Crescent, Dymchurch Road, Hythe CT21 6NU
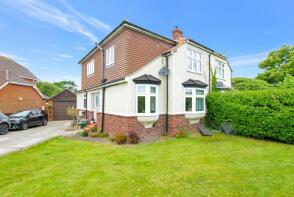
| Today | See what it's worth now |
| 16 Oct 2024 | £420,000 |
| 14 Dec 2018 | £305,000 |
125, Dymchurch Road, Hythe CT21 6JU
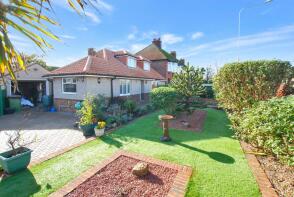
| Today | See what it's worth now |
| 12 Sep 2024 | £465,000 |
| 10 Dec 2007 | £273,000 |
No other historical records.
67, Princes Terrace, Dymchurch Road, Hythe CT21 6LY
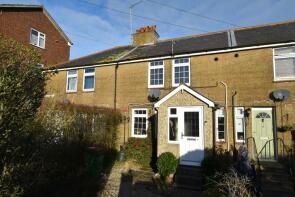
| Today | See what it's worth now |
| 4 Sep 2024 | £285,000 |
No other historical records.
38, Princes Terrace, Dymchurch Road, Hythe CT21 6LY

| Today | See what it's worth now |
| 9 Aug 2024 | £265,000 |
| 24 Aug 2023 | £180,000 |
113, Dymchurch Road, Hythe CT21 6JR
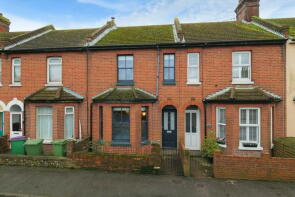
| Today | See what it's worth now |
| 6 Jun 2024 | £370,000 |
| 28 Aug 2015 | £150,000 |
No other historical records.
2, Dalmeny Terrace, Dymchurch Road, Hythe CT21 6LW
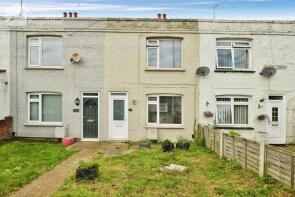
| Today | See what it's worth now |
| 12 Dec 2023 | £225,000 |
| 15 Jul 2005 | £120,000 |
No other historical records.
48, Dymchurch Road, Hythe CT21 6JX
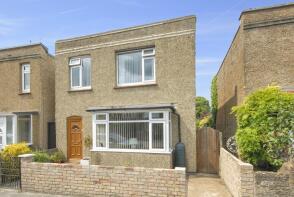
| Today | See what it's worth now |
| 10 Nov 2023 | £300,000 |
| 30 Sep 2016 | £224,000 |
90, Dymchurch Road, Hythe CT21 6LH
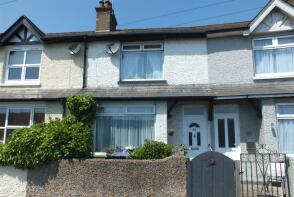
| Today | See what it's worth now |
| 10 Nov 2023 | £240,000 |
| 27 Jul 2011 | £125,000 |
West View, Dymchurch Road, Hythe CT21 4ND
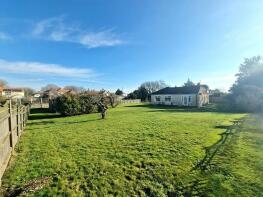
| Today | See what it's worth now |
| 20 Oct 2023 | £510,000 |
No other historical records.
5, Tweed Terrace, Dymchurch Road, Hythe CT21 6LP

| Today | See what it's worth now |
| 10 Oct 2023 | £158,000 |
No other historical records.
63, Dymchurch Road, Hythe CT21 6JE
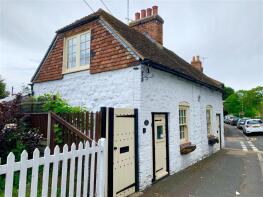
| Today | See what it's worth now |
| 4 Aug 2023 | £283,000 |
| 25 Jun 2019 | £229,950 |
95, Dymchurch Road, Hythe CT21 6JN
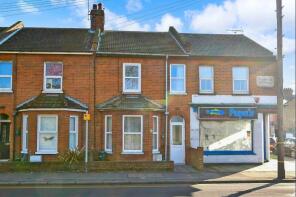
| Today | See what it's worth now |
| 31 Jul 2023 | £263,626 |
No other historical records.
133, Dymchurch Road, Hythe CT21 6JU
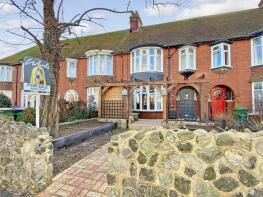
| Today | See what it's worth now |
| 9 Jun 2023 | £380,000 |
| 3 Nov 2017 | £242,500 |
No other historical records.
Annexe, The Willows, Dymchurch Road, Hythe CT21 4ND

| Today | See what it's worth now |
| 31 May 2023 | £340,000 |
| 9 Sep 2021 | £305,000 |
No other historical records.
1, Portland Court, Dymchurch Road, Hythe CT21 6JF
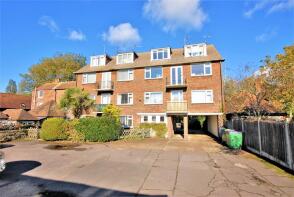
| Today | See what it's worth now |
| 18 Apr 2023 | £349,000 |
| 30 Jun 2022 | £215,000 |
41, Dymchurch Road, Hythe CT21 6JE
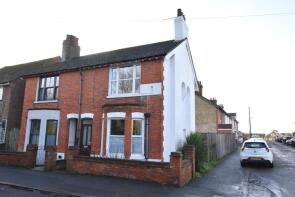
| Today | See what it's worth now |
| 27 Mar 2023 | £280,000 |
| 28 Jun 2021 | £280,000 |
No other historical records.
5, Dalmeny Terrace, Dymchurch Road, Hythe CT21 6LW
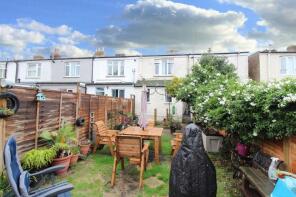
| Today | See what it's worth now |
| 24 Mar 2023 | £235,000 |
| 9 Nov 2020 | £177,249 |
123, Dymchurch Road, Hythe CT21 6JR

| Today | See what it's worth now |
| 13 Feb 2023 | £125,526 |
No other historical records.
88, Dymchurch Road, Hythe CT21 6LH

| Today | See what it's worth now |
| 3 Feb 2023 | £265,000 |
| 27 Apr 2018 | £215,000 |
99, Dymchurch Road, Hythe CT21 6JR
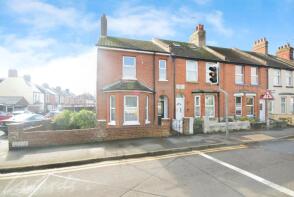
| Today | See what it's worth now |
| 3 Feb 2023 | £270,000 |
No other historical records.
Find out how much your property is worth
The following agents can provide you with a free, no-obligation valuation. Simply select the ones you'd like to hear from.
Sponsored
All featured agents have paid a fee to promote their valuation expertise.

Colebrook Sturrock
Hythe

The Good Estate Agent
National

Mapps Estates
Dymchurch

Lawrence & Co
Hythe
Get ready with a Mortgage in Principle
- Personalised result in just 20 minutes
- Find out how much you can borrow
- Get viewings faster with agents
- No impact on your credit score
What's your property worth?
House prices near Dymchurch Road
Source Acknowledgement: © Crown copyright. England and Wales house price data is publicly available information produced by the HM Land Registry.This material was last updated on 6 August 2025. It covers the period from 1 January 1995 to 30 June 2025 and contains property transactions which have been registered during that period. Contains HM Land Registry data © Crown copyright and database right 2025. This data is licensed under the Open Government Licence v3.0.
Disclaimer: Rightmove.co.uk provides this HM Land Registry data "as is". The burden for fitness of the data relies completely with the user and is provided for informational purposes only. No warranty, express or implied, is given relating to the accuracy of content of the HM Land Registry data and Rightmove does not accept any liability for error or omission. If you have found an error with the data or need further information please contact HM Land Registry.
Permitted Use: Viewers of this Information are granted permission to access this Crown copyright material and to download it onto electronic, magnetic, optical or similar storage media provided that such activities are for private research, study or in-house use only. Any other use of the material requires the formal written permission of Land Registry which can be requested from us, and is subject to an additional licence and associated charge.
Data on planning applications, home extensions and build costs is provided by Resi.co.uk. Planning data is calculated using the last 2 years of residential applications within the selected planning authority. Home extension data, such as build costs and project timelines, are calculated using approximately 9,000 architectural projects Resi has completed, and 23,500 builders quotes submitted via Resi's platform. Build costs are adjusted according to inflation rates to more accurately represent today's prices.
Map data ©OpenStreetMap contributors.
Rightmove takes no liability for your use of, or reliance on, Rightmove's Instant Valuation due to the limitations of our tracking tool listed here. Use of this tool is taken entirely at your own risk. All rights reserved.

