
House Prices in Curryload
House prices in Curryload have an overall average of £408,541 over the last year.
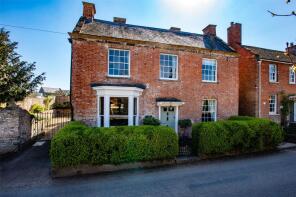
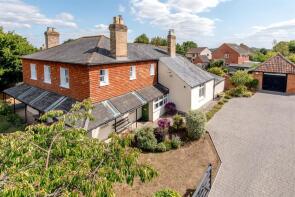
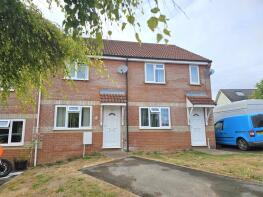
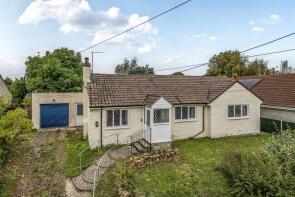
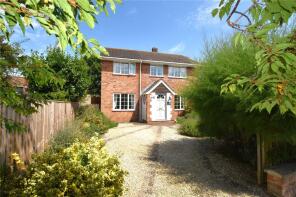
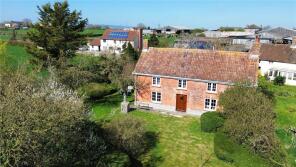
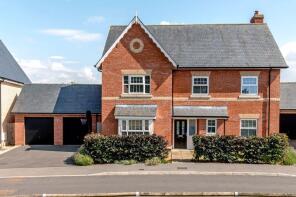
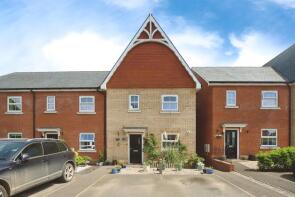
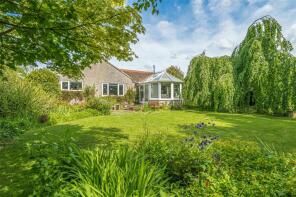
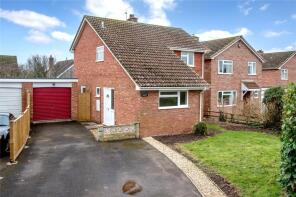
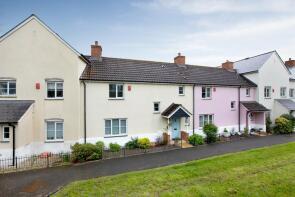
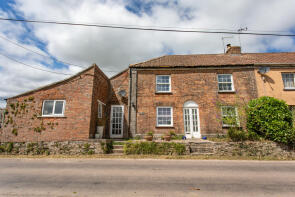
The majority of properties sold in Curryload during the last year were detached properties, selling for an average price of £521,598. Terraced properties sold for an average of £241,700, with semi-detached properties fetching £301,500.
Overall, the historical sold prices in Curryload over the last year were 17% down on the previous year and 21% down on the 2023 peak of £514,865.
Properties Sold
Cartwrights Barn, Lower Huntham Farm, Huntham Lane, Stoke St Gregory, Taunton TA3 6EY
| Today | See what it's worth now |
| 19 Mar 2026 | £515,859 |
No other historical records.
9, Stoke Road, North Curry, Taunton TA3 6LR
| Today | See what it's worth now |
| 13 Mar 2026 | £855,000 |
| 11 Dec 2007 | £685,750 |
7, Church Close, Stoke St Gregory, Taunton TA3 6HA
| Today | See what it's worth now |
| 12 Mar 2026 | £321,000 |
| 22 Aug 2006 | £215,000 |
No other historical records.
47, Station Road, Hatch Beauchamp, Taunton TA3 6SQ

| Today | See what it's worth now |
| 9 Feb 2026 | £225,000 |
| 4 Sep 2015 | £153,000 |
35, Overlands, North Curry, Taunton TA3 6JL
| Today | See what it's worth now |
| 30 Jan 2026 | £195,000 |
| 27 Jul 2017 | £150,000 |
8, Lockyers Field, North Curry, Taunton TA3 6FB
| Today | See what it's worth now |
| 27 Jan 2026 | £421,500 |
| 16 Nov 2022 | £410,000 |
Yew Tree Cottage, Windmill Hill, North Curry, Taunton TA3 6NA
| Today | See what it's worth now |
| 23 Jan 2026 | £575,000 |
| 26 Jan 2017 | £490,000 |
No other historical records.
75, Polkes Field, Stoke St Gregory, Taunton TA3 6EX
| Today | See what it's worth now |
| 16 Jan 2026 | £100,000 |
No other historical records.
Marshes Bungalow, Chapel Road, Isle Abbotts, Taunton TA3 6RR
| Today | See what it's worth now |
| 10 Dec 2025 | £265,000 |
| 1 Apr 2010 | £240,000 |
3, Jubilee Cottages, Willey Road, Stoke St Gregory, Taunton TA3 6EQ
| Today | See what it's worth now |
| 26 Nov 2025 | £367,000 |
| 26 Oct 2007 | £245,000 |
No other historical records.
Hancox Cottage, Hancox Farm Lane, Stoke St Gregory, Taunton TA3 6EP
| Today | See what it's worth now |
| 21 Nov 2025 | £575,000 |
| 8 Aug 2003 | £308,000 |
No other historical records.
15, Lockyers Field, North Curry, Taunton TA3 6FB
| Today | See what it's worth now |
| 14 Nov 2025 | £795,000 |
| 10 May 2019 | £660,000 |
No other historical records.
Church Cottage, Manor Road, Isle Abbotts, Taunton TA3 6RH
| Today | See what it's worth now |
| 7 Nov 2025 | £360,000 |
| 22 Sep 2000 | £99,000 |
No other historical records.
11, Lockyers Field, North Curry, Taunton TA3 6FB
| Today | See what it's worth now |
| 31 Oct 2025 | £227,500 |
| 16 May 2019 | £201,250 |
No other historical records.
25, Home Orchard, Hatch Beauchamp, Taunton TA3 6TG
| Today | See what it's worth now |
| 24 Oct 2025 | £570,000 |
| 29 Jan 2016 | £380,000 |
9, Longs Field, North Curry, Taunton TA3 6NN
| Today | See what it's worth now |
| 16 Oct 2025 | £525,000 |
| 25 Sep 2014 | £357,500 |
6, Portmans, North Curry, Taunton TA3 6NL
| Today | See what it's worth now |
| 7 Oct 2025 | £390,000 |
| 27 Oct 1999 | £103,000 |
19, Overlands, North Curry, Taunton TA3 6JL
| Today | See what it's worth now |
| 26 Sep 2025 | £377,500 |
| 8 Jul 2005 | £185,000 |
2, Langford Close, Fivehead, Taunton TA3 6QE

| Today | See what it's worth now |
| 15 Sep 2025 | £392,000 |
| 1 Dec 2011 | £244,000 |
No other historical records.
4, Church Close, Stoke St Gregory, Taunton TA3 6HA

| Today | See what it's worth now |
| 5 Sep 2025 | £318,000 |
No other historical records.
Abbotsbrook, Silver Street, Fivehead, Taunton TA3 6QA
| Today | See what it's worth now |
| 2 Sep 2025 | £610,000 |
| 3 Apr 2023 | £570,000 |
24, Huntham Close, Stoke St Gregory, Taunton TA3 6EZ
| Today | See what it's worth now |
| 8 Aug 2025 | £332,000 |
| 7 Jun 1999 | £93,500 |
7, Rectory Mews, Hatch Beauchamp, Taunton TA3 6AR
| Today | See what it's worth now |
| 25 Jul 2025 | £308,000 |
| 29 Jun 2007 | £259,000 |
No other historical records.
Curload Water, Curload Road, Curload Stoke St Gregory, Taunton TA3 6JE
| Today | See what it's worth now |
| 24 Jul 2025 | £287,500 |
| 28 Feb 2020 | £233,050 |
7, Queen Square, North Curry, Taunton TA3 6LD
| Today | See what it's worth now |
| 24 Jul 2025 | £140,000 |
| 19 Oct 2022 | £165,000 |
Source Acknowledgement: © Crown copyright. England and Wales house price data is publicly available information produced by the HM Land Registry.This material was last updated on 15 May 2026. It covers the period from 1 January 1995 to 31 March 2026 and contains property transactions which have been registered during that period. Contains HM Land Registry data © Crown copyright and database right 2026. This data is licensed under the Open Government Licence v3.0.
Disclaimer: Rightmove.co.uk provides this HM Land Registry data "as is". The burden for fitness of the data relies completely with the user and is provided for informational purposes only. No warranty, express or implied, is given relating to the accuracy of content of the HM Land Registry data and Rightmove does not accept any liability for error or omission. If you have found an error with the data or need further information please contact HM Land Registry.
Permitted Use: Viewers of this Information are granted permission to access this Crown copyright material and to download it onto electronic, magnetic, optical or similar storage media provided that such activities are for private research, study or in-house use only. Any other use of the material requires the formal written permission of Land Registry which can be requested from us, and is subject to an additional licence and associated charge.
Map data ©OpenStreetMap contributors.
Rightmove takes no liability for your use of, or reliance on, Rightmove's Instant Valuation due to the limitations of our tracking tool listed here. Use of this tool is taken entirely at your own risk. All rights reserved.