House Prices in Cray Road, Sidcup, Bexley, DA14
Properties Sold
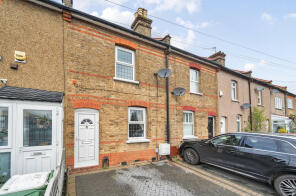
87, Cray Road, Sidcup DA14 5DL
| Today | See what it's worth now |
| 10 Oct 2024 | £350,000 |
| 29 Nov 1999 | £63,000 |
No other historical records.
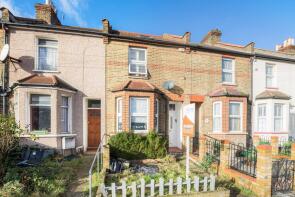
53, Cray Road, Sidcup DA14 5DE
| Today | See what it's worth now |
| 3 Nov 2023 | £350,000 |
| 25 Aug 2017 | £327,500 |
No other historical records.
6, Crayleigh Terrace, Cray Road, Sidcup DA14 5DQ

| Today | See what it's worth now |
| 18 Aug 2023 | £425,000 |
No other historical records.
31, Cray Road, Sidcup DA14 5BY

| Today | See what it's worth now |
| 17 Jun 2023 | £362,500 |
| 10 Nov 2006 | £183,000 |
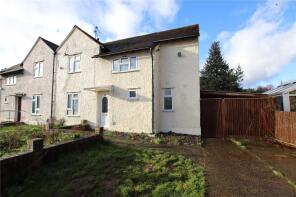
93, Cray Road, Sidcup DA14 5DL
| Today | See what it's worth now |
| 16 Jun 2023 | £420,000 |
| 30 Oct 2009 | £185,000 |
No other historical records.
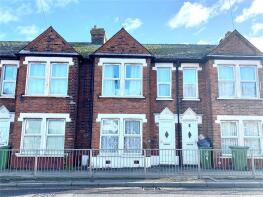
5, Orchard Villas, Cray Road, Sidcup DA14 5DJ
| Today | See what it's worth now |
| 11 Aug 2022 | £355,000 |
| 21 Apr 2017 | £264,000 |
4, Crayleigh Terrace, Cray Road, Sidcup DA14 5DQ
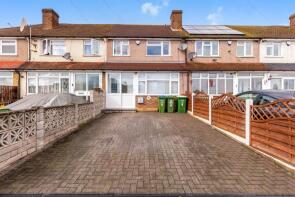
| Today | See what it's worth now |
| 9 Sep 2021 | £360,000 |
| 13 Dec 2013 | £229,995 |
45, Cray Road, Sidcup DA14 5DE
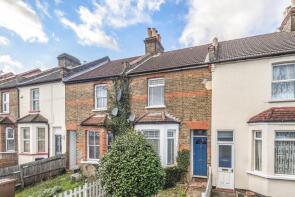
| Today | See what it's worth now |
| 24 Apr 2020 | £335,000 |
| 9 Dec 2013 | £196,000 |
83, Cray Road, Sidcup DA14 5DL
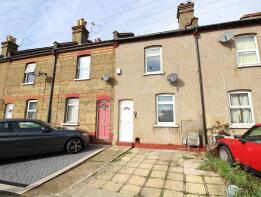
| Today | See what it's worth now |
| 23 Mar 2020 | £290,000 |
| 20 May 2008 | £150,500 |
63, Cray Road, Sidcup DA14 5DE
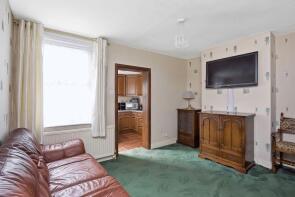
| Today | See what it's worth now |
| 6 Dec 2019 | £278,000 |
No other historical records.
4, Mayfield Villas, Cray Road, Sidcup DA14 5DH
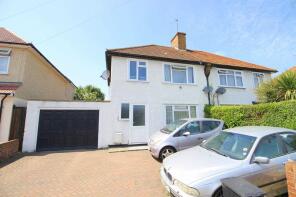
| Today | See what it's worth now |
| 31 Oct 2019 | £350,000 |
| 10 Jul 2002 | £146,000 |
77, Cray Road, Sidcup DA14 5DL

| Today | See what it's worth now |
| 26 Feb 2018 | £280,000 |
| 17 Mar 2006 | £163,000 |
103, Cray Road, Sidcup DA14 5DL
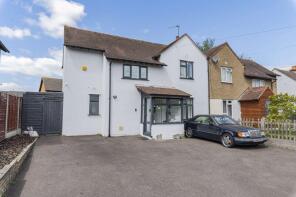
| Today | See what it's worth now |
| 3 Mar 2017 | £325,000 |
| 24 Jul 2012 | £180,000 |
No other historical records.
10, Mayfield Villas, Cray Road, Sidcup DA14 5DH
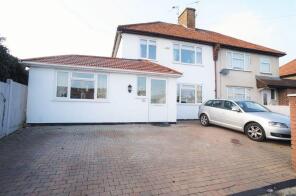
| Today | See what it's worth now |
| 29 Jul 2016 | £436,000 |
| 11 Dec 2009 | £246,000 |
No other historical records.
73, Cray Road, Sidcup DA14 5DE
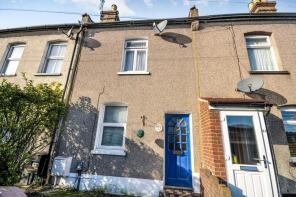
| Today | See what it's worth now |
| 25 May 2016 | £273,000 |
| 12 Apr 2001 | £90,000 |
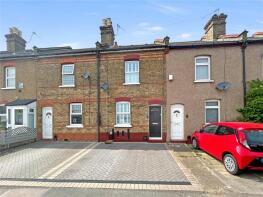
85, Cray Road, Sidcup DA14 5DL
| Today | See what it's worth now |
| 27 Nov 2015 | £240,000 |
| 24 Jan 2008 | £162,000 |
41, Cray Road, Sidcup DA14 5DE

| Today | See what it's worth now |
| 21 Oct 2015 | £1,000 |
No other historical records.
36, Cray Road, Sidcup DA14 5BZ

| Today | See what it's worth now |
| 20 Oct 2015 | £265,000 |
No other historical records.
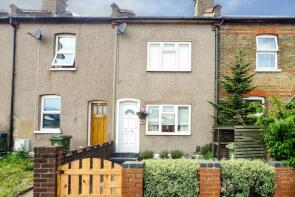
79, Cray Road, Sidcup DA14 5DL
| Today | See what it's worth now |
| 13 Aug 2015 | £250,000 |
| 27 Jul 2012 | £194,995 |
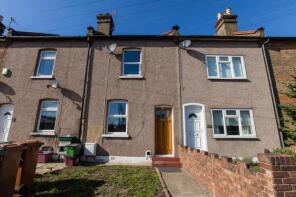
81, Cray Road, Sidcup DA14 5DL
| Today | See what it's worth now |
| 28 Feb 2014 | £188,000 |
| 29 Apr 2010 | £145,000 |
No other historical records.
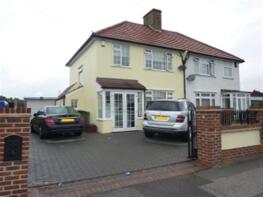
2, Mayfield Villas, Cray Road, Sidcup DA14 5DH
| Today | See what it's worth now |
| 23 Aug 2013 | £249,995 |
| 13 Sep 2007 | £242,000 |
49, Cray Road, Sidcup DA14 5DE
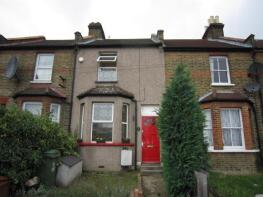
| Today | See what it's worth now |
| 6 Aug 2013 | £190,000 |
| 28 Feb 2011 | £180,000 |
61, Cray Road, Sidcup DA14 5DE
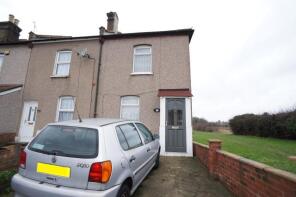
| Today | See what it's worth now |
| 23 Jul 2013 | £197,000 |
| 27 Mar 2007 | £205,000 |
30, Cray Road, Sidcup DA14 5BZ

| Today | See what it's worth now |
| 18 Feb 2013 | £205,000 |
| 18 Oct 2002 | £124,000 |
75, Cray Road, Sidcup DA14 5DE

| Today | See what it's worth now |
| 27 Jun 2011 | £185,000 |
| 5 May 2006 | £170,000 |
Find out how much your property is worth
The following agents can provide you with a free, no-obligation valuation. Simply select the ones you'd like to hear from.
Sponsored
All featured agents have paid a fee to promote their valuation expertise.

Ellis & Co
Sidcup

Chattertons
New Eltham

haart
Orpington

Village Estates
Sidcup

Christopher Russell
Sidcup, The Oval

Kallars
Sidcup
Get ready with a Mortgage in Principle
- Personalised result in just 20 minutes
- Find out how much you can borrow
- Get viewings faster with agents
- No impact on your credit score
What's your property worth?
Source Acknowledgement: © Crown copyright. England and Wales house price data is publicly available information produced by the HM Land Registry.This material was last updated on 20 November 2025. It covers the period from 1 January 1995 to 30 September 2025 and contains property transactions which have been registered during that period. Contains HM Land Registry data © Crown copyright and database right 2025. This data is licensed under the Open Government Licence v3.0.
Disclaimer: Rightmove.co.uk provides this HM Land Registry data "as is". The burden for fitness of the data relies completely with the user and is provided for informational purposes only. No warranty, express or implied, is given relating to the accuracy of content of the HM Land Registry data and Rightmove does not accept any liability for error or omission. If you have found an error with the data or need further information please contact HM Land Registry.
Permitted Use: Viewers of this Information are granted permission to access this Crown copyright material and to download it onto electronic, magnetic, optical or similar storage media provided that such activities are for private research, study or in-house use only. Any other use of the material requires the formal written permission of Land Registry which can be requested from us, and is subject to an additional licence and associated charge.
Data on planning applications, home extensions and build costs is provided by Resi.co.uk. Planning data is calculated using the last 2 years of residential applications within the selected planning authority. Home extension data, such as build costs and project timelines, are calculated using approximately 9,000 architectural projects Resi has completed, and 23,500 builders quotes submitted via Resi's platform. Build costs are adjusted according to inflation rates to more accurately represent today's prices.
Map data ©OpenStreetMap contributors.
Rightmove takes no liability for your use of, or reliance on, Rightmove's Instant Valuation due to the limitations of our tracking tool listed here. Use of this tool is taken entirely at your own risk. All rights reserved.

