
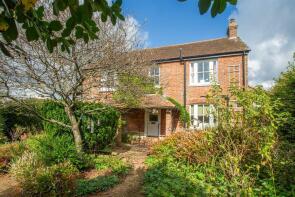
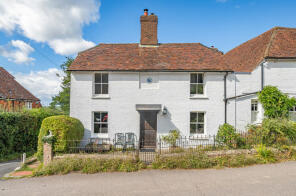
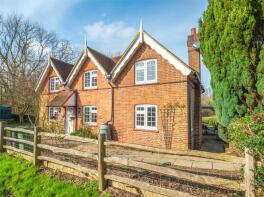
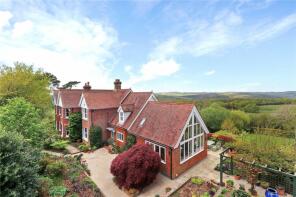
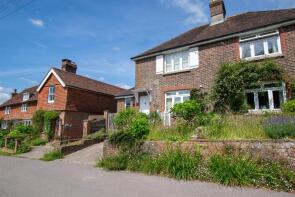
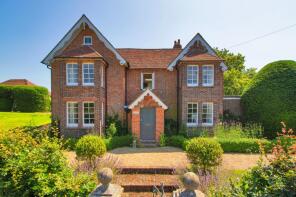
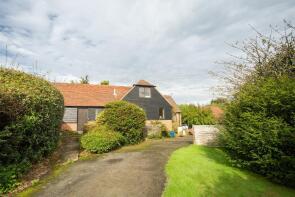
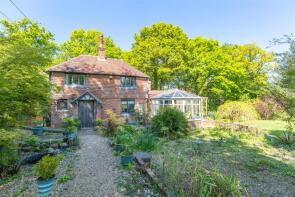
House Prices in Dallington
House prices in Dallington have an overall average of £602,500 over the last year.
Overall, the historical sold prices in Dallington over the last year were 17% down on the previous year and 53% down on the 2022 peak of £1,282,750.
Properties Sold
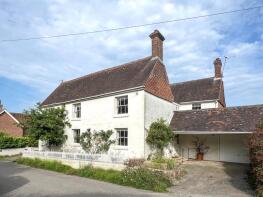
Frog House, The Street, Heathfield TN21 9NH
| Today | See what it's worth now |
| 28 Jan 2026 | £660,000 |
| 20 Nov 2018 | £725,000 |
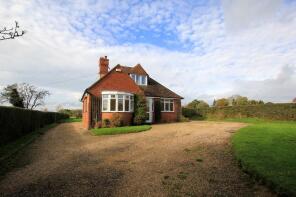
Four Winds, South Lane, Woods Corner, Heathfield TN21 9NJ
| Today | See what it's worth now |
| 3 Nov 2025 | £545,000 |
| 10 Mar 2004 | £260,000 |
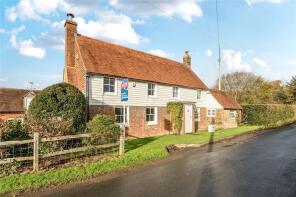
Redpale Farm, Redpale, Heathfield TN21 9NR
| Today | See what it's worth now |
| 25 Jun 2025 | £942,200 |
| 30 Nov 1995 | £145,000 |
No other historical records.
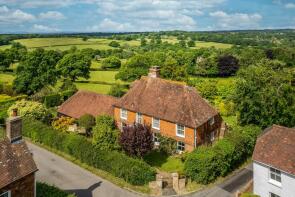
Yew Arch, The Street, Heathfield TN21 9NH
| Today | See what it's worth now |
| 30 May 2025 | £1,315,000 |
| 6 Sep 2012 | £1,200,000 |
Rokesley, The Street, Dallington TN21 9NH
| Today | See what it's worth now |
| 26 Mar 2025 | £540,000 |
No other historical records.
White Cottage, The Street, Heathfield TN21 9NH
| Today | See what it's worth now |
| 26 Mar 2025 | £440,000 |
| 24 Jun 2020 | £325,000 |
No other historical records.
Prospect House, Woods Corner, Heathfield TN21 9LB
| Today | See what it's worth now |
| 3 Oct 2024 | £385,000 |
No other historical records.
Yew Tree Cottage, Grovelye Lane, Heathfield TN21 9PA
| Today | See what it's worth now |
| 13 Aug 2024 | £725,000 |
| 17 Feb 2005 | £365,000 |
No other historical records.
Carrick House, The Street, Heathfield TN21 9NH
| Today | See what it's worth now |
| 26 Mar 2024 | £1,750,000 |
| 22 Apr 2005 | £695,000 |
No other historical records.
Earlsdown Farm, Earls Down, Dallington TN21 9JE

| Today | See what it's worth now |
| 18 Sep 2023 | £300,000 |
No other historical records.
Little Bucksteep Coach House, Churches Green Lane, Heathfield TN21 9NX

| Today | See what it's worth now |
| 5 May 2023 | £725,000 |
| 15 Aug 2014 | £540,000 |
Mole Cottage, The Street, Heathfield TN21 9NH
| Today | See what it's worth now |
| 14 Mar 2023 | £484,000 |
No other historical records.
The Old Manor, The Street, Heathfield TN21 9NH

| Today | See what it's worth now |
| 4 Nov 2022 | £1,250,000 |
No other historical records.
Little Bucksteep, Churches Green Lane, Heathfield TN21 9NX

| Today | See what it's worth now |
| 28 Sep 2022 | £2,877,750 |
| 3 Apr 2009 | £1,949,500 |
No other historical records.
Little Platt, South Lane, Woods Corner, Heathfield TN21 9NJ

| Today | See what it's worth now |
| 15 Sep 2022 | £975,000 |
| 28 Jan 2021 | £750,000 |
No other historical records.
Stream House, The Street, Heathfield TN21 9NE

| Today | See what it's worth now |
| 2 Sep 2022 | £1,100,000 |
| 3 May 2012 | £775,000 |
No other historical records.
1, Fullers Cottages, Woods Corner, Heathfield TN21 9LW

| Today | See what it's worth now |
| 9 Mar 2022 | £211,000 |
No other historical records.
Pelham Buckle, Battle Road, Heathfield TN21 9LE

| Today | See what it's worth now |
| 16 Nov 2021 | £428,000 |
| 27 Jun 2014 | £282,500 |
Pantons, The Street, Heathfield TN21 9NH
| Today | See what it's worth now |
| 12 Nov 2021 | £1,500,000 |
| 14 Aug 2015 | £940,000 |
No other historical records.
Wish House, Battle Road, Heathfield TN21 9JX
| Today | See what it's worth now |
| 28 Jun 2021 | £870,000 |
| 17 Apr 2014 | £615,000 |
Byres Cottage, Battle Road, Heathfield TN21 9LE
| Today | See what it's worth now |
| 24 Jun 2021 | £825,000 |
| 5 Feb 2021 | £415,260 |
Thistle Cottage, South Lane, Woods Corner, Heathfield TN21 9NJ

| Today | See what it's worth now |
| 2 Mar 2021 | £775,000 |
No other historical records.
Brambletye, Earls Down, Heathfield TN21 9JE
| Today | See what it's worth now |
| 5 Feb 2021 | £480,000 |
No other historical records.
Source Acknowledgement: © Crown copyright. England and Wales house price data is publicly available information produced by the HM Land Registry.This material was last updated on 9 July 2026. It covers the period from 1 January 1995 to 30 April 2026 and contains property transactions which have been registered during that period. Contains HM Land Registry data © Crown copyright and database right 2026. This data is licensed under the Open Government Licence v3.0.
Disclaimer: Rightmove.co.uk provides this HM Land Registry data "as is". The burden for fitness of the data relies completely with the user and is provided for informational purposes only. No warranty, express or implied, is given relating to the accuracy of content of the HM Land Registry data and Rightmove does not accept any liability for error or omission. If you have found an error with the data or need further information please contact HM Land Registry.
Permitted Use: Viewers of this Information are granted permission to access this Crown copyright material and to download it onto electronic, magnetic, optical or similar storage media provided that such activities are for private research, study or in-house use only. Any other use of the material requires the formal written permission of Land Registry which can be requested from us, and is subject to an additional licence and associated charge.
Rightmove takes no liability for your use of, or reliance on, Rightmove's Instant Valuation due to the limitations of our tracking tool listed here. Use of this tool is taken entirely at your own risk. All rights reserved.