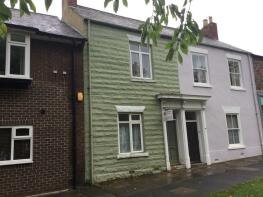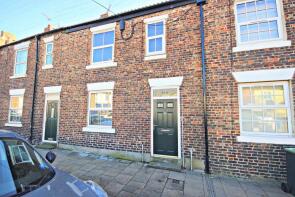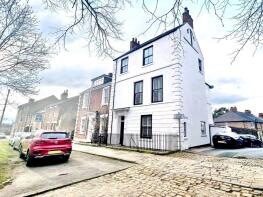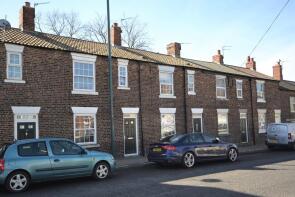
House Prices in Gilesgate, Durham, DH1
House prices in Gilesgate have an overall average of £384,500 over the last year.
The majority of properties sold in Gilesgate during the last year were semi-detached properties, selling for an average price of £339,000. Terraced properties sold for an average of £430,000.
Overall, the historical sold prices in Gilesgate over the last year were 118% up on the previous year and similar to the 2022 peak of £382,667.
Properties Sold
194, Gilesgate, Durham DH1 1QN

| Today | See what it's worth now |
| 28 Mar 2025 | £550,000 |
| 28 Jun 2019 | £300,000 |
No other historical records.
137, Gilesgate, Durham DH1 1QQ

| Today | See what it's worth now |
| 29 Nov 2024 | £350,000 |
No other historical records.
93a, Gilesgate, Durham DH1 1JA

| Today | See what it's worth now |
| 8 Aug 2024 | £310,000 |
| 18 May 2001 | £87,000 |
4, St Lukes Mews, Gilesgate, Durham DH1 1JA

| Today | See what it's worth now |
| 5 Jul 2024 | £328,000 |
| 12 Aug 2015 | £290,000 |
No other historical records.
83a, Gilesgate, Durham DH1 1HY

| Today | See what it's worth now |
| 10 Nov 2023 | £189,950 |
| 5 Apr 2000 | £75,500 |
No other historical records.
146, Gilesgate, Durham DH1 1QQ

| Today | See what it's worth now |
| 17 Aug 2023 | £162,500 |
No other historical records.
144, Gilesgate, Durham DH1 1QQ

| Today | See what it's worth now |
| 25 Apr 2023 | £390,000 |
| 13 Sep 2006 | £325,000 |
No other historical records.
215, Gilesgate, Durham DH1 1QN

| Today | See what it's worth now |
| 23 May 2022 | £458,000 |
| 9 Jul 2007 | £385,000 |
No other historical records.
3, St Lukes Mews, Gilesgate, Durham DH1 1JA

| Today | See what it's worth now |
| 22 Apr 2022 | £305,000 |
| 16 Dec 2014 | £280,000 |
No other historical records.
199, Gilesgate, Durham DH1 1QN

| Today | See what it's worth now |
| 2 Feb 2022 | £385,000 |
| 15 Apr 2019 | £375,000 |
127 Rose Cottage, Gilesgate, Durham DH1 1QG

| Today | See what it's worth now |
| 25 Nov 2021 | £182,000 |
| 25 May 2001 | £42,000 |
2, St Lukes Mews, Gilesgate, Durham DH1 1JA

| Today | See what it's worth now |
| 3 Mar 2021 | £260,000 |
| 12 Mar 2015 | £270,000 |
No other historical records.
210, Gilesgate, Durham DH1 1QN

| Today | See what it's worth now |
| 19 Feb 2021 | £450,000 |
No other historical records.
118, Gilesgate, Durham DH1 1QG

| Today | See what it's worth now |
| 31 Jul 2020 | £135,000 |
| 26 Mar 2004 | £126,500 |
70a, Gilesgate, Durham DH1 1HY

| Today | See what it's worth now |
| 30 Mar 2020 | £310,000 |
No other historical records.
119, Gilesgate, Durham DH1 1QG

| Today | See what it's worth now |
| 9 Jan 2020 | £152,000 |
| 19 May 2000 | �£59,950 |
No other historical records.
173, Gilesgate, Durham DH1 1QH

| Today | See what it's worth now |
| 22 Nov 2019 | £502,000 |
| 16 Mar 2010 | £575,000 |
No other historical records.
195, Gilesgate, Durham DH1 1QN

| Today | See what it's worth now |
| 18 Oct 2019 | £300,000 |
| 15 May 2013 | £300,000 |
No other historical records.
201, Gilesgate, Durham DH1 1QN

| Today | See what it's worth now |
| 28 Jun 2019 | £405,000 |
No other historical records.
90, Gilesgate, Durham DH1 1HY

| Today | See what it's worth now |
| 14 Mar 2019 | £395,000 |
| 26 Jun 2015 | £475,000 |
No other historical records.
122, Gilesgate, Durham DH1 1QG

| Today | See what it's worth now |
| 18 Feb 2019 | £160,000 |
| 9 Nov 2007 | £152,500 |
214, Gilesgate, Durham DH1 1QN

| Today | See what it's worth now |
| 11 Dec 2018 | £450,000 |
No other historical records.
166, Gilesgate, Durham DH1 1QH

| Today | See what it's worth now |
| 18 May 2018 | £165,000 |
| 31 Jul 2009 | £118,720 |
No other historical records.
139, Gilesgate, Durham DH1 1QQ

| Today | See what it's worth now |
| 27 Oct 2017 | £335,000 |
| 28 May 2014 | £345,000 |
117, Gilesgate, Durham DH1 1QG

| Today | See what it's worth now |
| 21 Jul 2017 | £115,000 |
| 28 Sep 2001 | £57,000 |
Find out how much your property is worth
The following agents can provide you with a free, no-obligation valuation. Simply select the ones you'd like to hear from.
Sponsored
All featured agents have paid a fee to promote their valuation expertise.

Reeds Rains
Durham City

Dowen
Durham

Robinsons
Durham

J W Wood
Durham City

Venture Properties
Durham

Elite Estates & Lettings
Durham
Get ready with a Mortgage in Principle
- Personalised result in just 20 minutes
- Find out how much you can borrow
- Get viewings faster with agents
- No impact on your credit score
What's your property worth?
Source Acknowledgement: © Crown copyright. England and Wales house price data is publicly available information produced by the HM Land Registry.This material was last updated on 16 July 2025. It covers the period from 1 January 1995 to 30 May 2025 and contains property transactions which have been registered during that period. Contains HM Land Registry data © Crown copyright and database right 2025. This data is licensed under the Open Government Licence v3.0.
Disclaimer: Rightmove.co.uk provides this HM Land Registry data "as is". The burden for fitness of the data relies completely with the user and is provided for informational purposes only. No warranty, express or implied, is given relating to the accuracy of content of the HM Land Registry data and Rightmove does not accept any liability for error or omission. If you have found an error with the data or need further information please contact HM Land Registry.
Permitted Use: Viewers of this Information are granted permission to access this Crown copyright material and to download it onto electronic, magnetic, optical or similar storage media provided that such activities are for private research, study or in-house use only. Any other use of the material requires the formal written permission of Land Registry which can be requested from us, and is subject to an additional licence and associated charge.
Map data ©OpenStreetMap contributors.
Rightmove takes no liability for your use of, or reliance on, Rightmove's Instant Valuation due to the limitations of our tracking tool listed here. Use of this tool is taken entirely at your own risk. All rights reserved.
