
House Prices in Dilston
House prices in Dilston have an overall average of £505,377 over the last year.
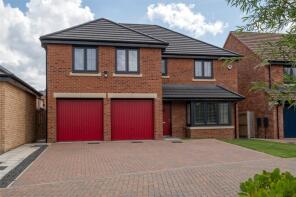
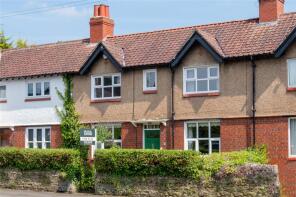
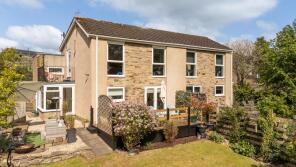
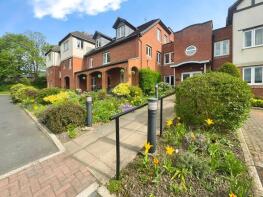
The majority of properties sold in Dilston during the last year were detached properties, selling for an average price of £685,375. Terraced properties sold for an average of £400,906, with semi-detached properties fetching £441,000.
Overall, the historical sold prices in Dilston over the last year were 19% up on the previous year and 3% up on the 2021 peak of £492,548.
Properties Sold
Cross House East, Princes Street, Corbridge NE45 5BB
| Today | See what it's worth now |
| 9 Apr 2026 | £730,000 |
| 7 Jul 1995 | £167,000 |
No other historical records.
9, Hill Street, Corbridge NE45 5AA
| Today | See what it's worth now |
| 26 Mar 2026 | £395,000 |
| 30 Oct 2020 | £310,000 |
12a, Windsor Court, Corbridge NE45 5BN
| Today | See what it's worth now |
| 20 Mar 2026 | £88,000 |
| 1 Oct 1999 | £37,500 |
No other historical records.
5 Holly House, Main Street, Corbridge NE45 5LE
| Today | See what it's worth now |
| 19 Mar 2026 | £750,000 |
| 14 Jan 2000 | £223,000 |
No other historical records.
1, Straker Gardens, Corbridge NE45 5JT
| Today | See what it's worth now |
| 24 Feb 2026 | £495,000 |
| 29 Jul 2015 | £375,000 |
No other historical records.
4, St Helens Place, Corbridge NE45 5BQ
| Today | See what it's worth now |
| 24 Feb 2026 | £375,000 |
| 14 Sep 2016 | £310,000 |
Prior Manor, Stagshaw Road, Corbridge NE45 5HR
| Today | See what it's worth now |
| 20 Feb 2026 | £1,600,000 |
No other historical records.
10, Cragside, Corbridge NE45 5EU
| Today | See what it's worth now |
| 20 Feb 2026 | £480,000 |
| 21 Oct 2016 | £340,000 |
12, Cragside, Corbridge NE45 5EU
| Today | See what it's worth now |
| 20 Feb 2026 | £630,000 |
| 15 Dec 2005 | £335,000 |
2, West End Terrace Mews, Corbridge NE45 5HA
| Today | See what it's worth now |
| 13 Feb 2026 | £242,000 |
| 14 Aug 2000 | £83,000 |
No other historical records.
14, Synclen Avenue, Corbridge NE45 5JF
| Today | See what it's worth now |
| 13 Feb 2026 | £225,000 |
| 29 Apr 2003 | £75,000 |
No other historical records.
21, Cragside, Corbridge NE45 5EU
| Today | See what it's worth now |
| 12 Feb 2026 | £557,500 |
| 16 Aug 2007 | £385,000 |
No other historical records.
5, Pembroke Drive, Roman Heights, Corbridge NE45 5SF
| Today | See what it's worth now |
| 12 Feb 2026 | £575,000 |
| 28 Jan 2022 | £458,995 |
No other historical records.
2, Coopers Court, Corbridge NE45 5TA
| Today | See what it's worth now |
| 10 Feb 2026 | £370,000 |
| 9 Aug 2001 | £150,000 |
No other historical records.
14, Crofts Way, Corbridge NE45 5NB
| Today | See what it's worth now |
| 18 Dec 2025 | £380,000 |
| 27 Jun 2016 | £250,000 |
No other historical records.
Town Farm Cottage, Trinity Terrace, Corbridge NE45 5HP
| Today | See what it's worth now |
| 18 Dec 2025 | £750,000 |
| 15 Jun 2021 | £475,000 |
No other historical records.
2, Eastlea, Cow Lane, Corbridge NE45 5HX

| Today | See what it's worth now |
| 17 Dec 2025 | £590,000 |
| 12 Sep 2013 | £365,000 |
3, Chillingham Court, Roman Heights, Corbridge NE45 5SD
| Today | See what it's worth now |
| 12 Dec 2025 | £632,863 |
| 4 Aug 2023 | £580,000 |
No other historical records.
9, Sussex Drive, Roman Heights, Corbridge NE45 5SE

| Today | See what it's worth now |
| 11 Dec 2025 | £470,000 |
| 31 Mar 2021 | £412,950 |
No other historical records.
3, Prior Terrace, Corbridge NE45 5HN
| Today | See what it's worth now |
| 7 Dec 2025 | £325,000 |
| 26 Aug 2004 | £250,000 |
26, Crofts Avenue, Corbridge NE45 5LZ
| Today | See what it's worth now |
| 28 Nov 2025 | £380,000 |
| 8 Jan 2016 | £270,000 |
15, Primlea Court, Aydon Road, Corbridge NE45 5ES
| Today | See what it's worth now |
| 27 Nov 2025 | £110,000 |
| 25 May 2016 | £122,000 |
No other historical records.
31, Crofts Avenue, Corbridge NE45 5LZ
| Today | See what it's worth now |
| 26 Nov 2025 | £325,000 |
| 23 Sep 2016 | £225,000 |

Source Acknowledgement: © Crown copyright. England and Wales house price data is publicly available information produced by the HM Land Registry.This material was last updated on 9 July 2026. It covers the period from 1 January 1995 to 30 April 2026 and contains property transactions which have been registered during that period. Contains HM Land Registry data © Crown copyright and database right 2026. This data is licensed under the Open Government Licence v3.0.
Disclaimer: Rightmove.co.uk provides this HM Land Registry data "as is". The burden for fitness of the data relies completely with the user and is provided for informational purposes only. No warranty, express or implied, is given relating to the accuracy of content of the HM Land Registry data and Rightmove does not accept any liability for error or omission. If you have found an error with the data or need further information please contact HM Land Registry.
Permitted Use: Viewers of this Information are granted permission to access this Crown copyright material and to download it onto electronic, magnetic, optical or similar storage media provided that such activities are for private research, study or in-house use only. Any other use of the material requires the formal written permission of Land Registry which can be requested from us, and is subject to an additional licence and associated charge.
Rightmove takes no liability for your use of, or reliance on, Rightmove's Instant Valuation due to the limitations of our tracking tool listed here. Use of this tool is taken entirely at your own risk. All rights reserved.