
House Prices in Dinnington
House prices in Dinnington have an overall average of £203,805 over the last year.
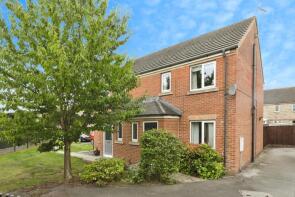
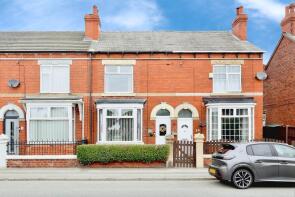
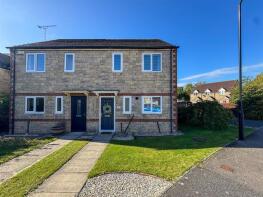
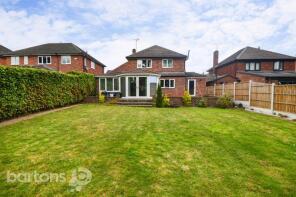
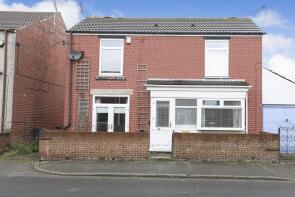
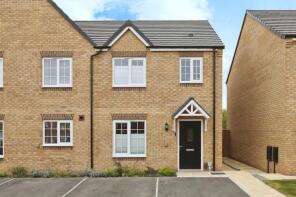
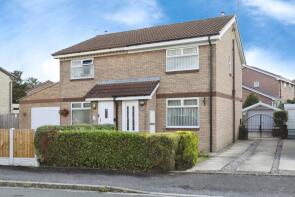
The majority of properties sold in Dinnington during the last year were semi-detached properties, selling for an average price of £185,808. Detached properties sold for an average of £279,847, with terraced properties fetching £124,132.
Overall, the historical sold prices in Dinnington over the last year were 2% down on the previous year and 4% down on the 2023 peak of £212,513.
Properties Sold
40, Trusdale Avenue, Dinnington, Rotherham S25 2DA
| Today | See what it's worth now |
| 15 Apr 2026 | £210,000 |
| 21 Dec 2023 | £208,995 |
No other historical records.
11, Limelands Road, Dinnington, Sheffield S25 2XG
| Today | See what it's worth now |
| 10 Apr 2026 | £265,000 |
| 16 Dec 2013 | £164,000 |
30, St Pauls Close, Laughton Common, Sheffield S25 3PL

| Today | See what it's worth now |
| 2 Apr 2026 | £175,000 |
| 29 Jun 2007 | £120,500 |
9, Poynton Drive, Dinnington, Sheffield S25 2UT
| Today | See what it's worth now |
| 2 Apr 2026 | £190,000 |
| 14 Sep 2007 | £142,950 |
6, Keats Drive, Dinnington, Sheffield S25 2SQ
| Today | See what it's worth now |
| 27 Mar 2026 | £165,000 |
| 21 Jul 2023 | £155,000 |
1, Waterloo Court, Laughton Common, Sheffield S25 3RT
| Today | See what it's worth now |
| 20 Mar 2026 | £200,000 |
| 28 Apr 2020 | £133,000 |
No other historical records.
3, Clarke Avenue, Laughton Common, Sheffield S25 3PJ
| Today | See what it's worth now |
| 19 Mar 2026 | £227,000 |
| 9 Jul 2004 | £129,950 |
11, Rotherham Road, Dinnington, Sheffield S25 3RG
| Today | See what it's worth now |
| 19 Mar 2026 | £120,000 |
| 18 Oct 2024 | £105,000 |
38, Glaisdale Close, Laughton Common, Rotherham S25 3SS
| Today | See what it's worth now |
| 16 Mar 2026 | £200,000 |
No other historical records.
11, Kensington Close, Laughton Common, Sheffield S25 3RY
| Today | See what it's worth now |
| 13 Mar 2026 | £205,000 |
| 20 Jul 2017 | £126,000 |
30, Swinston Hill Road, Dinnington, Rotherham S25 2SA
| Today | See what it's worth now |
| 6 Mar 2026 | £400,000 |
No other historical records.
23, Heathrush Drive, Dinnington, Sheffield S25 2DB

| Today | See what it's worth now |
| 27 Feb 2026 | £305,000 |
| 20 Dec 2022 | £297,995 |
No other historical records.
18, Washington Close, Dinnington, Sheffield S25 2XN
| Today | See what it's worth now |
| 27 Feb 2026 | £260,000 |
| 22 Mar 2022 | £208,500 |
23, Roddis Close, Dinnington, Sheffield S25 2XH
| Today | See what it's worth now |
| 24 Feb 2026 | £299,950 |
| 27 Sep 1996 | £67,950 |
No other historical records.
34, Hunters Chase, Dinnington, Sheffield S25 2TQ
| Today | See what it's worth now |
| 23 Feb 2026 | £195,000 |
| 1 Sep 2005 | £124,950 |
36, Baker Street, Laughton Common, Sheffield S25 3RU
| Today | See what it's worth now |
| 20 Feb 2026 | £175,000 |
| 3 Oct 2014 | £120,000 |
16, Lidgett Lane, Dinnington, Sheffield S25 2QD
| Today | See what it's worth now |
| 16 Feb 2026 | £138,000 |
| 2 Sep 2016 | £105,000 |
No other historical records.
3, Euston Way, Laughton Common, Sheffield S25 3RS
| Today | See what it's worth now |
| 30 Jan 2026 | £185,000 |
| 16 Oct 2019 | £135,000 |
Greenacre, Oldcotes Road, Dinnington, Rotherham S25 2QS
| Today | See what it's worth now |
| 26 Jan 2026 | £397,500 |
No other historical records.
78, Falcon Way, Dinnington, Rotherham S25 2NY
| Today | See what it's worth now |
| 23 Jan 2026 | £290,000 |
No other historical records.
8, Barnsley Street, Dinnington, Rotherham S25 2UJ
| Today | See what it's worth now |
| 22 Jan 2026 | £265,996 |
No other historical records.
26, Meadow Street, Laughton Common, Rotherham S25 3QN
| Today | See what it's worth now |
| 21 Jan 2026 | £115,651 |
No other historical records.
46, Trusdale Avenue, Dinnington, Rotherham S25 2DA
| Today | See what it's worth now |
| 15 Jan 2026 | £185,000 |
| 31 May 2024 | £219,995 |
No other historical records.

Source Acknowledgement: © Crown copyright. England and Wales house price data is publicly available information produced by the HM Land Registry.This material was last updated on 9 July 2026. It covers the period from 1 January 1995 to 30 April 2026 and contains property transactions which have been registered during that period. Contains HM Land Registry data © Crown copyright and database right 2026. This data is licensed under the Open Government Licence v3.0.
Disclaimer: Rightmove.co.uk provides this HM Land Registry data "as is". The burden for fitness of the data relies completely with the user and is provided for informational purposes only. No warranty, express or implied, is given relating to the accuracy of content of the HM Land Registry data and Rightmove does not accept any liability for error or omission. If you have found an error with the data or need further information please contact HM Land Registry.
Permitted Use: Viewers of this Information are granted permission to access this Crown copyright material and to download it onto electronic, magnetic, optical or similar storage media provided that such activities are for private research, study or in-house use only. Any other use of the material requires the formal written permission of Land Registry which can be requested from us, and is subject to an additional licence and associated charge.
Rightmove takes no liability for your use of, or reliance on, Rightmove's Instant Valuation due to the limitations of our tracking tool listed here. Use of this tool is taken entirely at your own risk. All rights reserved.